July has mercifully come to a close. It goes into the record books as
one of the hottest and driest July's on record. The featured chart
presents three metrics of how warm it was. The top graph displays the
number of days each July that the high temperature was at least 90
degrees. For Des Moines, July 2012 saw 27 days, which is the most of
any month on record! The middle chart presents average daily high
temperature and this year was easily the warmest since 1936. The
bottom chart is of average daily low temperature and it comes in second
warmest behind last year. You may recall that July 2011 was very
humid, which promotes warm over night low temperatures. Will August be
a warm and dry repeat of July?
On Wednesday, August started off where July left off as temperatures
soared into the upper 90s. This year has seen more than its fair share
of hot days. The featured chart presents the number of days during
2012 that were warmer than even the warmest day of a given previous
year. For example, there have been 31 days this year in Des Moines
that were warmer than the warmest temperature for all of 2004! The
overall chart average is 13 days, which is remarkable. The hot weather
looks to continue with another wave of really hot temperatures arriving
next week.
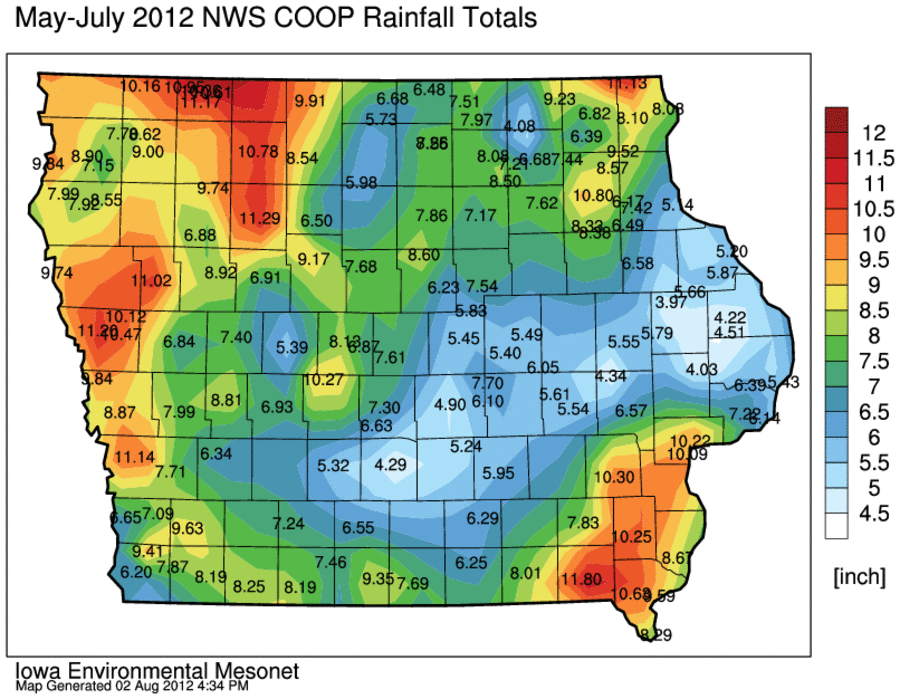
Rainfall was difficult to come by in July for Iowa. The featured map
is an analysis of July total of daily NWS COOP rainfall reports. There
are a few zeros on the map north and east of Omaha! To have a dry
month is a rare event, but for that month to be in the middle of summer
is even rarer. Even the lucky spots in the state that got upwards of
four inches were below average for the month. The first part of August
and the near term forecast do not hold out much hope for the hot and
dry weather to change anytime soon.
An intense cluster of thunderstorms rolled through Iowa on Saturday
bringing much needed rainfall to lucky portions of the state. The
rainfall was quite intense for some as shown by the featured graph of
one minute interval rainfall from the Davenport Airport site. 2.38
inches of rainfall was reported between 1:37 and 2:03 PM on Saturday.
The black line shows the one minute intensities extrapolated to an
hourly rate. The green line is the same extrapolation, but over a 15
minute trailing window. Unfortunately, intense rains like this
probably included significant run-off instead of soaking into the
ground. The water did not disappear though so rivers and lakes
benefited from this event as well.
Ideal cooling conditions on Monday morning allowed low temperatures to
reach the 40s for some locations in the state. These were record lows
for places like Waterloo and Mason City. The featured map is a simple
analysis of low temperatures reported on Monday. Having temperatures
in the 40s for the first week of August is a somewhat rare occurrence.
It had not happened in Iowa since 2009.
Tuesday was yet another very warm day this year with high temperatures
reaching the century mark for some in the state. This year continues
to be much warmer than any previous year on record for Des Moines. The
featured chart looks at the possibilities that this year will end up
being the warmest on record. The spaghetti of lines represents the
combination of this year's data and all previous year's data from today
to the end of the year. With these scenarios, 81% of the previous
year's data would provide this year with the warmest year on record. A
few weeks ago, this same chart was featured and the percentage was only
64%. The chart would indicate that this year will be the warmest on
record at least until Thanksgiving.
While much needed rain showers have recently graced much of Iowa, most
of this summer has been very dry. The lack of rainfall produces water
availability stress in plants and their production of water vapor by
transpiration is decreased. The result should show up in decreased air
humidities as shown by the featured chart of Des Moines daily mean
mixing ratio (the amount of water in the air versus total air). In
general, this has been the case for most of the summer with humidity
values running near or below long term average. The warm and humid
weather we had in March is probably the most noticeable feature in this
chart. The initial wet period we had to start May also shows up as an
elevated period of higher humidities.
The latest US Drought Monitor released this week shows continued
degradation in Iowa with now more than half of the state in "Extreme"
drought category. The featured chart shows the weekly areal coverages
of drought categories over Iowa. The "Extreme" category has doubled in
size during the past week. August has seen near daily occurrences of
rain in the state and some heavier totals since the last drought report
valid on Tuesday. Unfortunately, this rain is coming very late in the
growing season and we still could use plenty more to help the crops
that still can be salvaged.
The drought of 2012 for Iowa will certainly go down as one of the more
extreme on record. Since most people can remember the drought of 1988,
comparisons continue to be made to that year with many wondering which
year was more severe. While there is no correct answer, the featured
chart provides two metrics for comparison. The x-axis presents the
accumulated, from 10 August back to the given date, precipitation
departure for both this year and 1988. For the period since 1 January,
1988 had the least amount of precipitation since 1893. The two lines
show that 1988's drought started much earlier in the year than 2012,
but the intensity of the drought during the growing season has been
slightly worse (for this period) in 2012. The chart also shows you how
much precipitation we would need to erase a given deficit over some
period. For example, at least ~8 inches are needed in order to erase
the deficit since 1 May.
Our recent respite from the hot weather has been on the few cooler than
average periods this year as shown by the featured chart displaying
daily high and low temperature departures from average for Des Moines.
The sustained warmth of March and July shows up clearly on this chart
as well. The forecast only has a brief warm up this week before highs
return to the 70s to end the week. Great weather for the Iowa State
Fair!
Sustained rainfall has been very difficult to come by for this growing
season. Even getting a seven day period with above average rainfall
has been rare for most places in the state and especially the
southeastern quarter of Iowa. The featured chart presents the number
of days each growing season to date that the previous seven days
(inclusive) of precipitation was above average for Cedar Rapids. For
this metric, this year has the second lowest total since 1900. The next
seven days look to be on the dry side of average as well with only
modest chances of rain.
A few weeks back, we featured a plot known as an aridity plot showing
the combination of seasonal temperature and precipitation departure
from average. This departure is measured in units of standard
deviation to provide a closer comparison between temperature and
precipitation departures. 2012 still ranks up there with the other
legendary years of Iowa's climatological past. A simple linear fit is
also shown. While the correlation is a bit low, the implication is
that dry years tend to be warm and wet years tend to be cool.
August has seen a few very warm days and then a number of rather cold
days for this time of year. The current result is for the statewide
average temperature to be below average for August. The featured chart
shows recent monthly temperature departures and if this departure
holds, it would be the first below average month since September of
last year. The extreme warmth of March 2012 sticks out like a sore
thumb on this chart. The near term forecast has high temperatures
below average, so perhaps August will finish on the cool side!
The featured chart presents yearly time series of USDA reported weekly
corn crop condition for Iowa and five nearby states. The charted line
represents the total area estimated to be in either "poor" or "very
poor" condition. These are the two worst categories that are
designated. Each chart contains the time series for each year since
1986. Conveniently, this allows us to compare this year with the last
major drought of 1988 in the Midwest. Other significant years of 2005
and 1993 are included for comparison. While 2012 has been devastating
in Missouri, Illinois, and Indiana, things have not been all that bad
in Minnesota. Compare that with what happened in 1993 where Minnesota
got the worst of it. It is not for certain how much some recent rains
in the Midwest will help the corn crop as the damage has pretty much
already been done in the hardest hit areas.
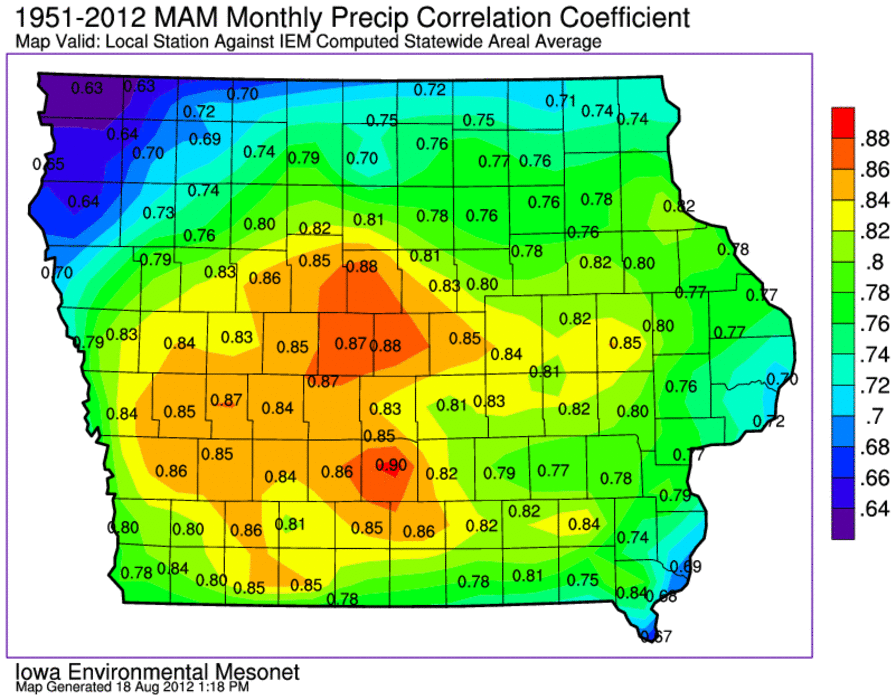
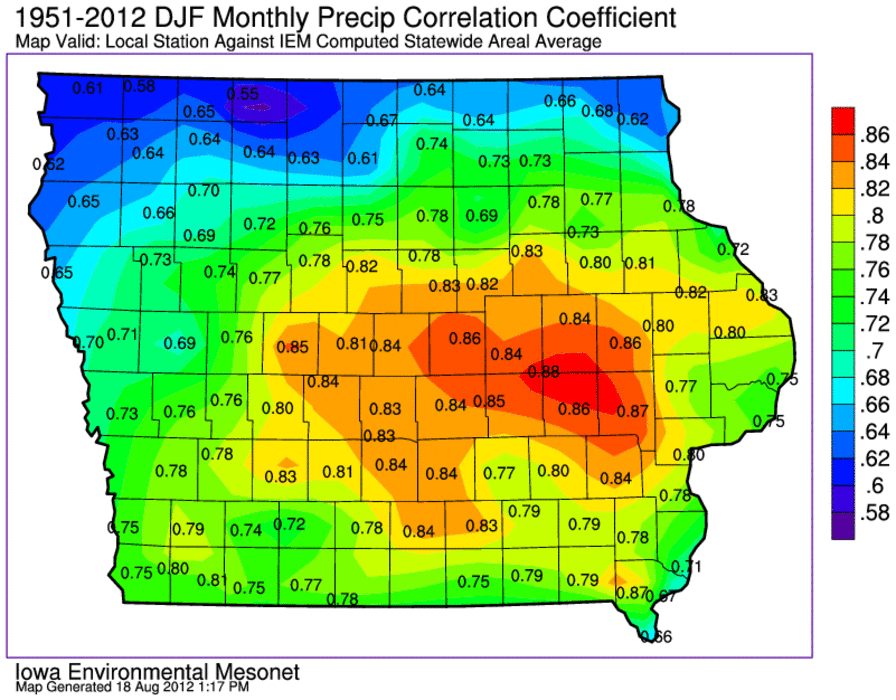
Since we like to identify ourselves by the state we live in, climate
parameters are often provided on a state by state basis. Given that
precipitation varies on very fine spatial and temporal scales, how
representative are statewide values for a location in Iowa? The
featured map presents a simple analysis of the correlation coefficient
between the monthly statewide precipitation value and the local site's
monthly total. One could think of this map as which location in the
state has monthly precipitation that most resembles the statewide areal
average. Intuitively (since we are a land locked state), the middle of
the state is the most representative. Northwestern and extreme
southeastern Iowa show up with the lowest values as they both lie at
the extremes of the annual precipitation for the state. Ames shows up
with the highest value, so those of us at Iowa State are the most
representative of Iowa! :)
For temperature and precipitation, it has been well established that
this growing season has been a lot like 1988 (our previous worst
drought year). It is interesting when other metrics, like the one
presented in today's feature plot, equal 1988 as well. The featured
chart presents the number of days per year with at least one tornado
warning issued for somewhere in the state of Iowa. Due to the nature
of having severe convection happen over midnight, a day is considered
to be a 24 hour period ending at 7 AM. This year has only seen 6 days,
which is the smallest total since 1988! The green bar represents the
number of days after 19 August until the end of the year. 1988 saw an
additional day with tornado warnings issue, will 2012 as well?
During the blistering hot month of July, some wondered just how bad it
would be for the state fair in August! Turns out, the weather was some
of the coolest seen in the recent decade. The featured chart presents
the simple daily average high and low temperature for each state fair
period back to 1880. Some of the years are blank due to there being no
fair that year. Years above long term average are in red and below are
blue. The cool weather certainly boosted attendance and made the week
more bearable for the carny folk.
The mostly dry conditions and lack of robust vegetation have lead to
very dry conditions for this time of year. Dew points have accordingly
been running very low this month. The featured chart presents the
maximum and minimum dew point for the first 19 days of August for each
of the past years since 1933 for Des Moines. Both values this year are
some of the lowest on record and the lowest they have been in quite
some time. The red bars are years at or lower than 2012. In order for
the first freeze to occur, the dew point has to drop to freezing
temperature as well. Could the low dew points be a harbinger of things
to come, namely an early freeze?
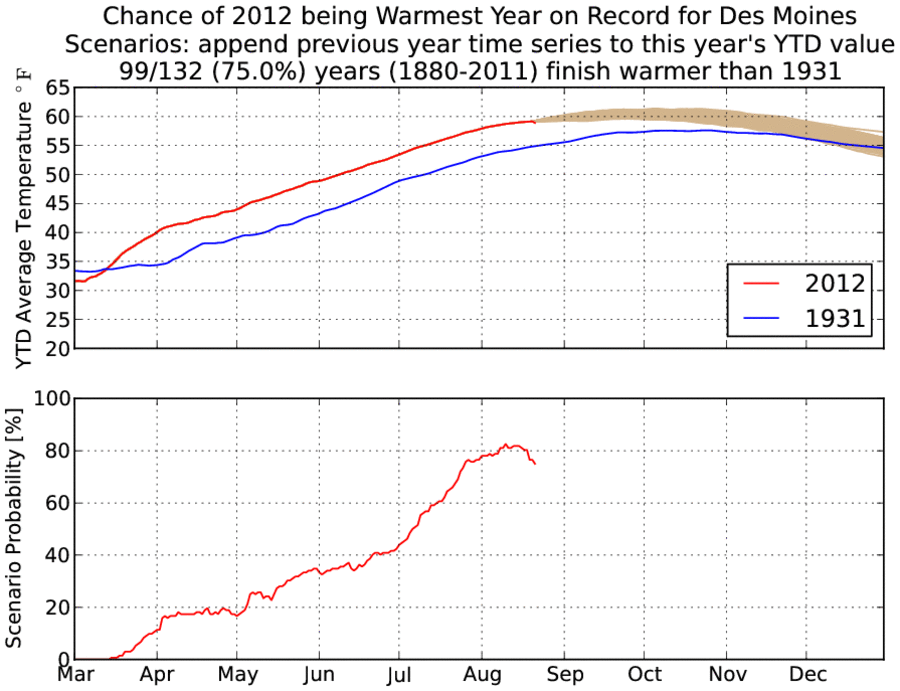
After the very warm July, we were nearing "metaphysical certaintude"
that this year would be the warmest on record for Des Moines. Most of
August has been a different story and we have lost some of our lead
over the next warmest year on record (1931). The featured chart
presents the year-to-date average temperature along with a spaghetti
plot of scenarios to finish the year with based on previous year's
observations. The number of scenarios that finish this year warmer
than 1931 can be thought of as probability. As of today, this
probability is near 75% which is down from a few weeks ago. The bottom
chart tracks this probability over time showing that July certainly put
us on track to be the warmest, but August is slacking off a bit.
The difference in dew point temperature from the air temperature is
called the dew point depression. On Wednesday, the dew point
depressions in Iowa were over 50 degrees Fahrenheit for some locations
with a air temperature in the 90s and dew point in the 40s. For Iowa,
this is a very rare event! The featured chart presents the largest
dew point depression by year and the minimum dew point observed with an
air temperature at or above 95 for Des Moines. The bottom chart shows
that having such a low dew point and high temperature is very rare and
last happened in 1955 (red bars). The upper chart shows that having a
50+ degree spread has happened in a number of past years, but for
August it last happened in 1936 (not shown)!
Thursday was yet another warm day for Iowa and Des Moines had its 50th
day with a high temperature at or above 90 degrees. This makes for the
largest total of days since 1988 as shown by the featured image. Only
five other years than 2012 have had 50+ days over 90 degrees and we
still have just over four months to go this year! The bottom chart
presents the number of days each year above 90 for days after 23
August. We would need another 10 days to catch 1983 and then a bunch
more to catch 1934 and 1936. The forecast has a high very close to 90
on Friday and then more close to 90 weather next week, so we are saying
that we have a chance...
The rainfall much of Iowa received this weekend is almost too good to
believe! Rainfall totals on Saturday reached 3-4 inches over
southwestern Iowa. The featured image is a combination of rainfall
estimates and modeled surface water runoff from the storms on Saturday.
This model output is from the Iowa Daily Erosion Project found on this
website. Areas that are shown picking up 2-3 inches of rain only show
less than a half of an inch of runoff. The reason being that the rains
feel at a reasonable pace and there is vegetation around to slow down
rain drops before they strike the ground. It also helped that the
ground was quite thirsty! Heavy rains are continuing on Sunday with
Lamoni reporting over 8 inches for the event!
Tropical Storm Isaac continues to under-perform expectations for
development into a Hurricane, but remains a great worry for folks along
the northern Gulf of Mexico. The featured map is a composite of
National Hurricane Center position and max wind forecasts for the past
week. The thicker line with a white outline is the actual observation
of wind speed and position. Isaac has yet to reach Hurricane strength
of 75mph winds, but is a large system that is expected to dump very
heavy rainfall. Our weather will stagnate while this system clears out
to the east later this week.
Warm and rather muggy weather has returned to Iowa with highs around 90
degrees. The forecast calls for more of this weather for this week to
end August. Will the end of August bring the end of 90 degree weather
for Des Moines? The featured chart presents the last day each year
whereby the high temperature was at or above 90. The black line
represents the average last date, which is still in our future this
year! The bottom chart is a simple comparison between the last 90
degree date and the average temperature for that year. The really warm
years do not necessarily have a late last 90 degree day. With this
year set to smash the average temperature record, we will not
necessarily see 90 degree weather into October.
The rainfall this past weekend was certainly welcome and helped to put
a dent in some of the deficits that have built up this year. The
featured map presents an estimate of the past seven days of rainfall
along with the drought status valid at the beginning of this period.
Most of the heaviest rainfalls fell over southern Iowa in the area
currently in D2 (Severe) status. A majority of central and east
central Iowa missed out and will probably remain in D3 (Extreme) status
for this week's drought monitor update. A ray of hope does exist with
Hurricane Isaac as some models are tracking the remnants of the system
into Iowa, which would bring a very welcome rainfall.
Tropical Storm Isaac continues to pound the southern plains with heavy
rain and strong winds. The size of these storms is sometimes difficult
to imagine for those of us who have lived in Iowa their entire life.
So what better way to illustrate the size of Isaac than to move the storm
here for comparison! The featured map moves Isaac as depicted on RADAR
yesterday morning to Iowa with its eye near Des Moines. The size of
this storm is certainly comprehensible as nearly the entire state is
engulfed by it! The remnants of Isaac may actually make it to Iowa in
a few days, but its form will look much different than this.
Thursday was the second of two very warm days for late August in Iowa.
Des Moines hit 97 after reaching 96 on Wednesday. This is latest date
for two straight days with such a warm temperature since 1990. The
featured chart presents the latest date for having two days at or above
a given high temperature threshold. For example, having two days at or
above 90 has happened as late as the first week of October. While
Friday will be slightly cooler, we will stay above average until the
middle of next week.


