The featured map displays unofficial and IEM computed climate district precipitation total
ranks for June. A value of one would indicate that June 2015 was the wettest June on
record for the location since 1893. A considerable chunk of the corn belt is analyzed in the
top 5 wettest Junes with a number of locations currently at number 1! It is interesting to
see the variability in the map with large gradients across some states, like Iowa.
The featured chart displays the daily high temperature standard deviation for Des Moines
for two variables. The first being the spread of highs for a given day and the second being
the spread of day to day changes in high temperature. The lower chart presents the ratio
between these two values. July shows the least variability for both parameters as warm
soils and elevated humidities help to regulate temperatures. The chart shows that the day
to day variability is lower than the long term variability for that day. This makes sense as
the long term distribution of temps creates a bounds for the day to day variability and also
there is a bit of memory in the day to day temperatures, so the daily high temperature
yesterday has a higher influence than the high temperature for the previous year for that
date.
The featured map displays USDA estimated soybean planting progress with the departure
from long term average shown. Missouri is shown to be well behind average while the rest
of the Midwest (save Kansas) is practically done. Wet conditions over the state are to
blame and this was even the case into southern Iowa as soybean planting was late there
this year as well.
With no measurable precipitation reported on Saturday nor Sunday for the Des Moines
Airport, this July 4th weekend was the first weekend without rain since the 4th-5th of April!
The featured chart displays the daily precipitation reports in a calendar format. The Ts on
the chart represent traces of precipitation reported. Rain returned to the state overnight
with more chances of rainfall this afternoon.
Very warm weather has been difficult to come by this year. The featured chart displays the
daily high temperature departures from long term average for Ames. Since March, we have
only seen a few days with the high temperature 10 plus degrees above average. That looks
to continue for the remainder of this week with highs only in the 70s.
Considering that it is July, temperatures on Tuesday were a bit chilly. At 1 PM, the
temperature was in the low 70s for Des Moines. The featured chart presents the frequency
of having the air temperature between 65 and 74 degrees at 1 PM by month of the year.
For July, this is only a 10% frequency or you can think of it as roughly 3 days out of each
July meeting that criteria. We have a few more chilly days to go before some of the
warmest weather of the year arrives this weekend.
The half way point of meteorological summer is nearly at hand, so it is appropriate to
compare how average temperatures compare between the first and second half of summer.
The featured chart does just that by comparing the trailing 45 day period to 15 July with the
following 45 day period for Des Moines. The average high this year will come in well below
average, so one may wonder if the second half of the summer has a chance to be above
average. Quadrant II would be the sector for this combination and the frequency is just
above 11%.
After our recent stretch of cool summer days, it is a good time to check in on Growing
Degree Day (GDD) totals since 1 May. The featured chart shows the increasing departure
from average our recent cool weather has put us into. While warmer weather is in the
forecast, it is difficult to make up ground as this is the warmest time of the year and so our
expected GDD accumulation is already high.
Visible satellite imagery on Friday morning captured swirls in the smoke plume from
Canada. These swirls are always present in the atmosphere, but we often can not see
them in the cloud formations. Much like how people use tracers in a wind tunnel to see how
the air is flowing, the smoke plume was doing a similar thing in the atmosphere.
Summertime heat has returned in a big way to Iowa with today expected to be even warmer
than Sunday with highs well into the 90s and oppressive humidity levels. The NWS has
issued a heat advisory for much of the state with some portions now in an Excessive Heat
Warning! The featured chart looks at the period between the first and last Heat Advisory
issued by NWS Des Moines and the number of events per year. July and August are the
months that we see the combination of high temperatures and high humidities which are
needed to drive the heat index well above 100 degrees.
Monday turned up the heat a bit more from Sunday with highs into the 90s for most of the
state. For Des Moines, the temperature was already 80 degrees at 7 AM. The featured
chart displays the hourly frequency of having a 80+ degree temperature for July. The
period around sunrise has the lowest frequencies as this tends to be the coolest part of the
day and the frequencies peak in the mid afternoon.
The featured chart displays the daily range between the observed minimum and maximum
dew point for Ames this year. The most humid air so far this year arrived this past weekend
with dew points approaching 80 degrees. Any day with a dew point above 60 is highlighted
in red in this chart and you can see nearly every day since 1 June has been above this
level.
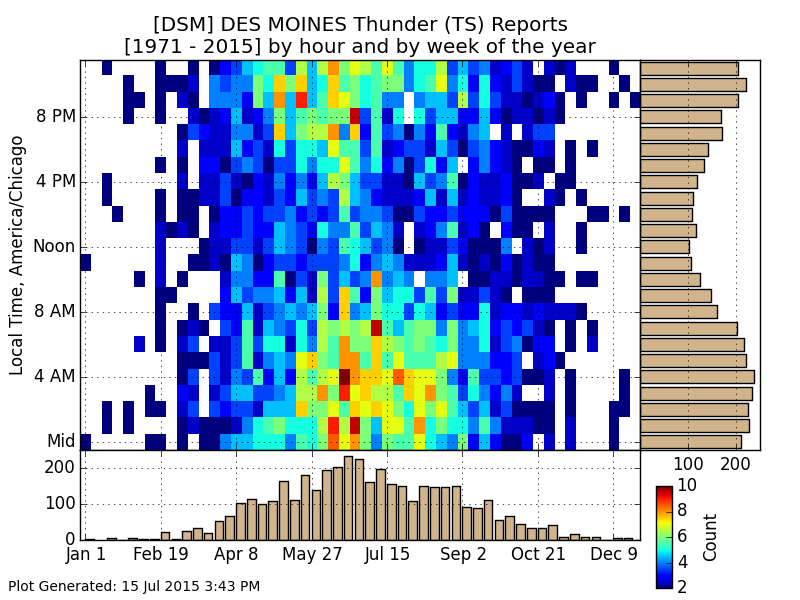
A complex of thunderstorms is currently rumbling over the state this Thursday morning.
The Des Moines weather station has reported thunder for most of the overnight hours
today. The featured chart presents the frequencies of thunder being reported by the Des
Moines Airport weather station. The bottom and right side bar charts display a histogram of
these reports by week of year and hour respectively. The early morning hours are the
favored time for thunder reports as much of Iowa's summertime precipitation is driven by a
phenomena called the 'Low Level Jet'. This jet feeds unstable air into Iowa during the
overnight hours.
The featured picture was captured by the webcam on the ISU Ag Farm just south and west
of Ames on Thursday. This landspout was reported to have briefly touched down, but no
damage has been found at the time of this writing. This storm prompted a tornado warning
for Ames that lead many to discover that Ames has talking sirens now! These landspouts
are formed when a strong updraft stretches an area of spin into a smaller area, which
increases the rate of spin. Check out the recent news item with a link to the YouTube lapse
of this event.
The presence of clouds has an impact on near surface air temperature, but that impact
varies by time of day and time of year. The featured chart attempts to tease out the impact
by looking at the simple difference between hours that have significant cloud cover versus
all hourly temperature reports. A general summation of the chart is that clouds suppress
temperatures during the daytime and support temperatures at night time. There is a day of
the year impact as well with the largest differences occurring in the fall season.
Temperatures have cooled nicely back into the 50s for much of Iowa this Tuesday morning.
It has been a while since we have seen cooler than average low temperatures as shown by
the featured plot. We have to go back to 10 July to find our last cooler than average low.
The featured map displays NOAA MRMS precipitation estimates since the first of July.
There is a lot of variability in the state with rainfall totals estimated over six inches in some
locations and under one inch in others! The US Drought Monitor has northwestern Iowa
now in D0 (abnormally dry) classification.
The featured chart presents the warmest high and coldest low each July for Ames with the
bottom chart representing the range between those two values. The bottom panel is very
interesting as it shows a long term trend of decreasing temperature range with this year
falling in line with recent years below the long term average. One theory for this trend is
that humidity levels have increased during July, which help to moderate swings in
temperatures (difficult to get very hot during the day and very cold at night).
The last few days have seen lows in the 50s and highs in the low 80s, which is on the cool
end on what we would expect for July. The featured chart displays a 2D histogram of the
combination of daily highs and lows for Ames during July. The highest frequency bin is a
few degrees warmer than our recent weather. The forecast for Friday and this weekend
has a return of the hot and sticky weather.
The featured chart displays the 1 May to date accumulation of growing degree days for
Ames. The top panel displays the actual accumulation this year and the climatology. The
bottom panel displays the accumulated departure from average. The last few weeks have
seen about average temperatures, so our accumulated departure has not made up any
lost ground. This is a difficult time of year to make up GDD departures as our daily
average accumulation is already a high value, so even with record temperatures we can
not make up too much ground quickly.
Not all precipitation events are equal. The featured chart attempts to show which precip
events are the most effective at producing rain over areas that actually need it. The top
chart displays the areal coverage of daily precipitation over 0.5 inches and the amount of
that area that was coincident with an area that had received less than 0.5 inches over the
previous seven days. The bottom chart shows the area of the state that was below 0.5
inches over the past seven days and percentage of that area that got 0.5 inches that day.
Confusing? The moral of the story is that some rain events happen over areas that are
already wet making them less effective at relieving previously dry areas. You can generate
this chart online for other years for comparison.
With only a few days of July remaining and those forecasted to have highs in the 80s, it
looks like this July will continue the recent trend of cooler maximum temperatures as shown
by the featured chart. The maximum July temperature for Ames is shown along with 3
average metrics. A long term average, an average only considering the 1981-2010 period,
and a trailing 30 year moving average. The bar coloring represents if that July was below
the long average. This chart illustrates one of the strong climate change signals in the
state, which is for lower peak maximum temperatures during the summer.
For Sunday to Tuesday (3 days), the Des Moines Airport reported over an inch of rain
each day. This is only the sixth such streak on record for the site. The featured chart
presents some statistics on streaks of precipitation for the site. The green line represents
the maximum value over which the number of days had daily precipitation at or above that
level. The chart indicates that four days is the longest consecutive streak of daily rainfall
over an inch. The blue line represents the highest daily average precipitation over a given
number of days. You can multiple this value to get the actual maximum accumulation over
that number of days, so for example the value of 2 at 5 days represents an accumulation of
10 inches. Or restating, the highest five day accumulation for the site is 10 inches.
The past two days have seen very large differences in dew point develop during the
afternoon hours between the Ames and Des Moines airport weather stations. The tan bars
on the featured chart show Ames 10+ degrees higher than Des Moines for each of the past
two days, but not for the two days prior What could be happening to cause this difference?
The blue line is calculated latent heat flux from a flux station nearby to Ames. This value is
a proxy to evapotranspiration and magnitude of the values indicate significant amounts of
surface/ground water were being transpired into the air. So a theory is that the Ames
airport station, which is literally surrounded by corn and soybean fields has elevated
humidity levels during the day while the Des Moines station was drier without the
substancial nearby agricultural fields. Having said that, NWS Des Moines plans to visit the
Des Moines weather station today to check the sensor for issues, so it will be interesting to
see what they find out!