The latest update of the US Drought Monitor has all levels of drought
eliminated from the state and the featured chart shows that the
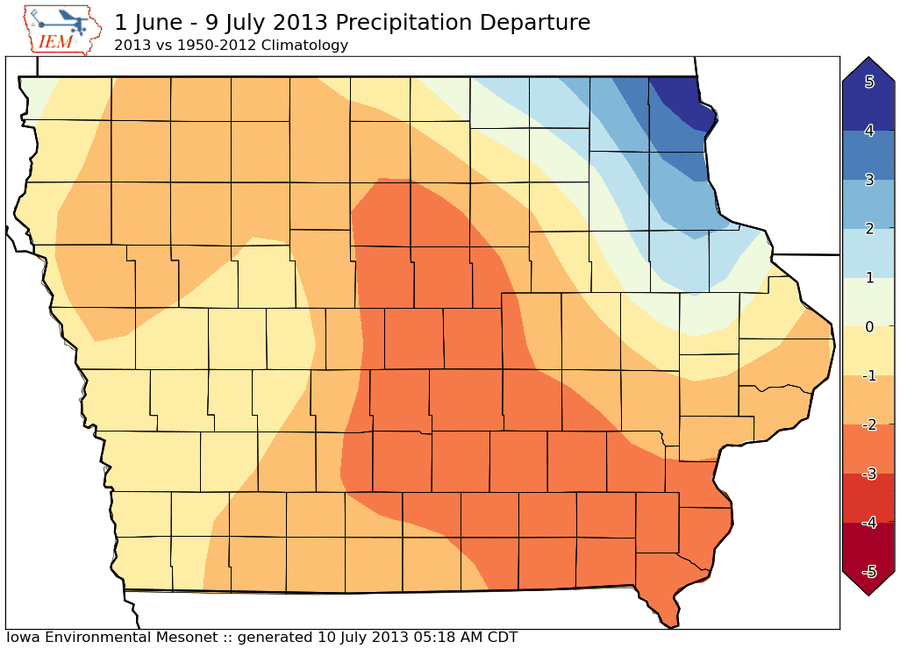
statewide precipitation departure for the past year is now positive!
It has taken the wettest spring on record and a wet June to get us back
to average for Iowa. The forecast for the first week of July looks to
be mostly dry and rather cool. Of course, drought could start creeping
back in the state with a dry July and August, but we shall see!
Temperatures were just about average across the state on Monday with
the 4 PM temperature at Des Moines of 84 degrees coming in at the long
term average for the first week of July at 4 PM. The featured set of
pie charts present the percentage of days that the 4 PM temperature was
either above or below average when a given condition occurred. For
example, when there was no rainfall between 8 AM and 4 PM the
temperature was above average about 55% of the time. However, when it
did rain, about 75% of the days had a below average temperature at 4
PM. Having an overcast sky at 4 PM also shows a strong signal with 76%
of the days also being below average at 4 PM for temperature.
The featured map presents an analysis of the contribution heavy
rainfall events have to the overall precipitation total. For this
plot, these events are defined as daily precip totals at or above two
inches. The map shows the percentage of total precipitation that
comes during these events. For Iowa, about 10-15% of the annual precip
comes from these intense events. The pattern over the Midwest shows
the maximum over southeastern Kansas and minimums over northern
Michigan and western North Dakota. The reason being the combination of
higher precipitable water (potential for heavy rainfall) the further
south (warmer temperatures providing more capacity to hold water vapor)
and the favored areas for thunderstorms (clash of air masses providing
lift).
Happy 4th of July! The featured image presents the weather condition
reported by the Des Moines site at 10 PM on the 4th of July since 1951,
which is about the time of legal firework displays in Iowa! If the
given year satisfies the condition shown, it gets a star on the chart.
The left hand side then presents the number of years out of the past 62
that this condition has occurred and the numbers along the top show how
many out of the four were meet for that year. Having rain during the 9
to 10 o'clock hour is the least common among these. This year would
appear to have none of these conditions present with a very comfortable
dew point, temperature in the 70s, and nearly clear skies.
Thanks to a wet spring and June, Iowa made up its 365 day precipitation
deficit from the drought of 2012. The featured chart presents some
metrics related to making up this year long precipitation deficit. The
top panel displays the daily rate the deficit was made up as measured
from the date with the largest deficit to when the deficit was erased.
The second panel displays the number of days it took for the given
deficit to be erased. The bottom panel displays the depth and time of
each period since 1900 with a deficit for statewide precipitation.
This year's deficit bottomed out at 9.18 inches on 26 Jan 2013 and was
erased on 24 June 2013 (red items on chart). The chart shows that once
the long term deficit reaches four or more inches, it will probably
take three months or more to recover.
After having plenty of rain during the spring season and June, rain has
been difficult to come by for the first seven days of July. The
statewide total so far is second driest behind 1940 according to IEM
calculations. Some heavy rainfall has fallen in extreme northeastern
Iowa this morning and more chances of rain are in the forecast for this
week. The black line on the chart shows the normal accumulation of
nearly an inch and getting about an inch of rain per week is about
normal for most of the summer.
The featured chart presents the yearly maximum heat index and date of
maximum for Des Moines since 1935. This year's maximum barely exceeded
100 degrees and would be one the lowest minimums on record if it stood
for the rest of the year. But it is only the second week of July and
as the bottom chart shows, most years experience its hottest heat index
sometime in July and August. Today looks to be a very hot day with heat
index values for Des Moines expected in the 100s.
After a very wet spring and a wet June for some in Iowa, July has
started off dry. It is hard to believe that we are again worried about
precipitation departures, but they are back for much of the state.
Extreme northeast Iowa got some very large totals in June and has seen
the limited July precip events so far. The forecast for the next week
looks very dry and so this situation appears to only get worse. For
farmers, we are left with a late planted crop that will be needing rain
soon after whatever soil moisture reserves built up from this spring
are exhausted. Remember that we came into this spring with very low
moisture reserves due to the drought of 2012.
Very comfortable air arrived in Iowa on Wednesday with dew point
temperatures only in the 50s. The featured map looks at how common it
is to have sub 60 degree dew point temperatures in July. Iowa is
analyzed in the 20-40 percent of the time range with frequencies
decreasing the further south you go. The benefit of having such a low
dew point temperature is that it allows the air to cool to that
temperature overnight making for windows-open sleeping weather!
Humidity is expected to slowly build back into the state with dew
points back into the 60s to 70s next week.
Most are familiar with the old adage; "Red sky at night, sailor's
delight. Red sky at morning, sailor take warning." Does this saying
apply for us land-locked Iowans? IEM's webcam archive contains an
image every five minutes dating back to as far as 2003. For the
featured analysis, webcam images approximately 10 minutes prior to
sunrise and 10 minutes after sunset were analyzed for amount of red in
the sky. The algorithm attempted to differentiate red sky from the red
horizon that is common with everyday sun rises and sets. Of 2300 some
sunrises and sunsets, 248 red sunrises and 88 red sunsets were
identified by an algorithm. For these events, hourly precipitation
data from Ames was queried to see if measurable precipitation fell in
the 24 hours proceeding the event. The third bar is daily climatology
which shows not much of a signal with these events, but there is a
slight increase for red sky at morning events. Obviously, a limited
sample and computer program does not prove or disprove this adage.
On average, the third week of July is the warmest week of the year as
shown by the featured chart. The bottom panel shows the number of
years since 1879 that the given week was actually the warmest for that
year. The warmest week has happened any time during the summer and
even into September. The warmest week so far this year was June 18-
25th at just over 78 degrees. The forecast for this week has some warm
temperatures included, but does not appear to be warmer than the
current warmest for this year.
Rain has been very difficult to come by this July for most of the
state. The featured chart displays an analysis of precipitation
percentage of average for the first 15 days of July. Most of the state
is shown in the 0 to 20% range with the actual accumulation labeled on
the map. Des Moines has only reported six hundredths of an inch, which
is the driest start since 1975. The forecast continues the dry weather
with temperatures in the 90s for the rest of the week.
The weather pattern earlier this week was a bit strange with the
southern plains experiencing a storm system that traveled west! The
winds well above the ground surface, that help guide storm systems,
were actually from the east. The featured chart looks at the frequency
of easterly winds at a height of 200 hPa (millibars), which is about 7-
8 miles above the earth surface. The chart presents 12 wind roses, one
for each month for the sounding site near Omaha. The site launches a
weather balloon twice per day, providing a vertical profile of
temperature, humidity, pressure, and winds. The wind roses provide
frequencies of wind direction and speed. Westerlies clearly dominate
for all months of the year. Each month is labelled with the percentage
of observations that are primarily easterly. The highest percentages
(although meager) are in the summer time, which is when the jet stream
(very strong westerlies) is furthest away permitting such flow to
occur. So while such events are very rare, this is the time of year
when they most frequently happen.
The featured map displays the estimated percentage of corn areas per
state that are currently tasseled/silking along with the departure from
the past 30 years average for the second week of July. The western
Corn Belt is way behind with only 1% estimated in both Iowa and
Minnesota. The corn crop is behind schedule due to late planting dates
because of cold spring weather and wet conditions. These estimates
were valid for four days ago and a visual survey of your local corn
crops probably shows more acres now tasseling. This is an important
time for corn development and it desperately needs moisture. Having
hot and dry conditions during this period is not good for the eventual
yield.
This week has a warm and muggy one with heat indices pushing 100
degrees in some locations. The popular phrase, "it isn't the heat, its
the humidity", means that warm temperatures are bearable unless high
levels of humidity exist at the same time. The featured chart presents
the frequency of having either a 3+ or 5+ difference between the
temperature and heat index when the air temperature is at or above 80
degrees. This "humidity effect" indicates how often the humidity
levels are high enough to produce a noticeable difference from the
temperature. Long term averages are shown for each value with bars
above or below average colored separately. For Des Moines, about 50%
of the time when temperatures are above 80 the heat index is adding at
least three degrees to the temperature. The average is just below 30%
for a five degree change.
A number of severe thunderstorm watches have been issued today by the
Storm Prediction Center (SPC). None of these in Iowa though. Anyway,
the featured chart presents the daily frequencies of SPC issued watches
and the ratio between the number of severe thunderstorm versus tornado
watches issued. Both have clear annual signals with their respective
peaks happening at different times of the year. The largest number of
watches (dots) occur during the strongest battles of the air masses
during the spring season. The bars shows the ratio of severe
thunderstorm versus tornado warnings. This ratio peaks out during the
first two weeks of August as temperatures are the warmest over the
United States and the cool air masses are well north leading to less
wind shear in the atmosphere.
Rain is at least falling in parts of the state this Sunday, but some
locations picked up a bit too much rain in a little time. The featured
chart is of one minute interval precipitation from the Chariton
SchoolNet site showing 3.5 inches of rain falling in just an hour. The
plot also shows extrapolated hourly rates over different periods of
periods. For example, the peak hourly rate over an one minute period
was over eight inches! Of course, the most intense rates do not last
that long.
It actually rained in Iowa on Sunday with the Des Moines Airport
picking up eighteen hundredths of an inch! This was the first daily
rainfall over a tenth of an inch since 24 June. The featured chart
presents the longest stretch of days between 1 May and 31 August each
year for Des Moines in between daily rainfalls of at least a tenth of
an inch. The simple average of this chart is just over 17 days with
the stretch this year being the longest since 1988. All of the years
with a longer stretch than this year are labelled on the chart.
Yesterday marked the 10th year of webcam imagery collection by the IEM.
This is thanks to our partners (KCCI-TV, KCRG-TV, KELO-TV, and the Iowa
Department of Transportation) who allow us to collect and archive
images from their respective networks. The featured chart shows the
number of images saved per year along with the first image collected
from the KCCI-TV webcam in Jefferson back in 2003. These images are
valuable environmental data providing easily discernible visual reports
of sky and ground conditions. Along the way, over 300 lapses have been
uploaded to YouTube,
including a very popular Gravity Wave video with over 1.3 million views!
While the rain that fell on Monday evening was welcome, the storms also
brought along damaging winds and some hail. The storms also produced a
heat burst event, which was nicely captured by the Knoxville AWOS site
as shown by the featured chart. Heat bursts are produced behind
thunderstorm complexes as warm air is forced to the ground. This air
continues to warm as it descends and since no water is being added, its
relative humidity drops resulting in warm and dry air at the surface.
The classic signature, as shown in the chart, is a rapid increase in
temperature and decrease in dew point at a surface observation site.
These events tend to be very windy as well with the site reporting a
gust over 70 mph. Note that the chart would indicate the gust lasting
for a number of minutes, but that is most likely a quirk with how wind
gusts are reported by the sensor.
The featured chart presents an analysis of the number of days since the
last half inch plus rainfall for a calendar day. The western half of
of the state is shown in the 30-45 day range as rainfall events have
been difficult to come by. Northwestern Iowa would appear to have a
chance of breaking this streak this evening as strong storms are
expected. As with our most recent storm, the rainfall is much needed
but unfortunately may come with damaging wind as well.
The precipitation gains made this spring to practically eliminate the
drought condition in the state are being lost thanks to a dry June and
July. The featured chart shows the percentage of the state covered by
analyzed drought condition from the National Drought Monitor. The most
recent update to this analysis has over 50% of the state now covered by
abnormally dry condition (D0). The good news is that there have been
recent rains, but the heaviest totals have mostly missed the western
half of the state. More chances of rain are in the forecast, but the
heaviest totals will be to our south and east.
While rain has been difficult to come by in July for Iowa, Oklahoma has
seen plenty of it. The featured chart is of one minute interval
precipitation for Oklahoma City ASOS on Friday showing extremely
intense rainfall. The 5:16 AM minute accumulation was 0.3 inches of
rain, which extrapolated to an hour yields a rate of 18 inches! For a
rain gauge with a tipping bucket mechanism, this means a tip every 2
seconds! Sadly, OKC's daily total is more rainfall than most of Iowa
has seen this July.
The low temperature dipped to 51 degrees for Des Moines on Sunday
morning, which set a record low temperature. How common is this cold
of a temperature in July? The featured chart presents a means by which
low temperature frequencies can be compared to high temperature
frequencies by equating their respective percentiles. A line is shown
for each month of the year. So for July, the 51 degree low temperature
compares with a high temperature around 104. Restating, Des Moines has
about the same number of days at or below 51 degrees for a low
temperature as it does for having a high temperature at or above 104.
So you could say the weather this morning is as common as a high of
104!
The past few days have been rather remarkable for July with record lows
being set over parts of the midwest. Each day the sun heats the
ground, which warms the air near to the ground. This warmed air
vertically mixes growing what is known as the planetary boundary layer.
The air temperature we experience near the ground is a result of the
strength of the surface heating and the mixed air down from above. The
featured chart shows a climatology of air temperatures at the 850 hPa
pressure level for the sounding site near Minneapolis for its 12 UTC
(6/7 AM CT). This level is typically included in the planetary
boundary layer. For this recent event, the temperature at this level
(2.2 centigrade) was the coldest on record for the site in July.
The featured chart presents a time series of trailing 14 day departures
of temperature and precipitation for Iowa. The line connects this
metric computed every seven days and the points are labelled for the
end of the 14 day period. The start of the line is on the first of
April and the line ends with today. The chart shows that our past two
weeks closely resemble the two weeks ending on 1 April with cool and
dry weather. These types of plots often create loops when the
variables are correlated. Our next period of weather looks to continue
the dry weather, but closer to average temperatures are expected.
The featured chart is an aridity chart showing the combination of
temperature and precipitation departure for the month of July expressed
in units of standard deviation from average. The total so far for this
July is shown on the chart as a red dot and is nearly the same value as
1947! There have been other IEM daily features this year showing 2013
trending like 1947. Extreme dots on this chart are labelled and 1993
certainly stands out (the great flood year). A simple fit is made
through this plot showing the inverse relationship as below average
temperature is correlated with above average precipitation. This July
is a bit unique in the regard of being one of the most extreme in
quadrant III (below average temperature and below average
precipitation).