June is now in the books and this year still ranks as the warmest on
record for most sites in the state. The featured chart shows the year
to date ranking and departure from warmest for Ames. We took the lead
in mid-March and have not looked back. Given that the lead is so large
and this next week looks to be blisteringly warm, we should stay as the
warmest year on record well into September (for worst case with
theoretical record cold July and August weather). The most realistic
chance to lose the warmest year on record would be for a cool fall and
cold November and December.
Monday was yet another really warm day in Iowa with temperatures well
into the 90s for most. Des Moines had a high temperature for the
second straight day at or above 97 degrees. The featured chart looks
at the longest such daily streaks of having a high temperature above 97
for each year since 1880. About two or three days are about as long as
these hot spells last for years that even get this warm. The forecast
suggests that we could reach seven days, which would be the longest
streak since August 1983.
The featured map presents a simple display of the location of 100+
degree daily high temperature reports from the NWS COOP network. While
these reports have been common over Missouri, Kansas, and Nebraska,
they have struggled to cross the border into Iowa. You can even notice
roughly the same effect in northern Illinois. What would make this
area unique? Certainly the intensive cropping along with some timely
rains have helped to keep conditions a bit more humid here, which makes
it harder to warm in the mid afternoon. Iowa could certainly start to
see its share of 100 degree weather if the rains stop and this hot
weather pattern continues.
The summer of 2012 continues on its dry and hot path with the first
four days of July near 100 degrees and bone dry for most in the state.
One of the harder hit areas is east central Iowa. The featured chart
presents the combination of precipitation and stress degree days (units
of daily high temperature above 86 degrees) for the 1 May to 4 July
period for Cedar Rapids. The deviant years are labeled. For Cedar
Rapids, this growing season is one of the driest on record. For stress
degree days, this year has the largest accumulation since 1988. Of
course, most of us remember how bad that year was for the drought in
Iowa.
Our recent stretch of sunny days, hot temperatures, and mostly dry
conditions have elevated soil temperatures to some of the warmest
recorded by the ISU AgClimate network. The featured chart presents the
warmest average daily four inch depth soil temperature for the Ames
site since its installation back in 1986. It is possible that
temperatures will warm even more as we are not yet to their
climatological peak in August.
The high temperature reached the century mark at Des Moines for the
third straight day on Friday. The featured chart presents the warmest
three day period (in terms of average high temperature) each year since
1880. The last year to have a three day period average over 100
degrees was 1988. The two warmest years in this chart were during the
1930s (1934 and 1936). The good news is the oppressive heat is being
pushed out of the state on Saturday and highs are expected back in the
80s next week.
The forgettable week of blistering hot weather for Iowa has mostly come
to an end this Sunday. The high temperature in Des Moines hit 100+
degrees for four straight days, but only on Saturday did it tie a
previously set record. The featured chart presents the dates and years
of daily high temperature records being set or tied. Of note, is the
lack of events in July as shown by the highlighted area. In fact, it
has been since 1955 that a record was either tied or set in July for
Des Moines! The plot overall shows a lack of new records in the summer
months. A common explanation for this is that our increased
agricultural activity has increased dew points during the summer months
through increased plant transpiration. Heating this moisture rich air
takes more energy and acts to suppress high temperatures in the mid
afternoon. Or others may say that the dust bowl era (1930s) rewrote
our summertime records to levels that will be very difficult to exceed
without another organized large scale drought event.
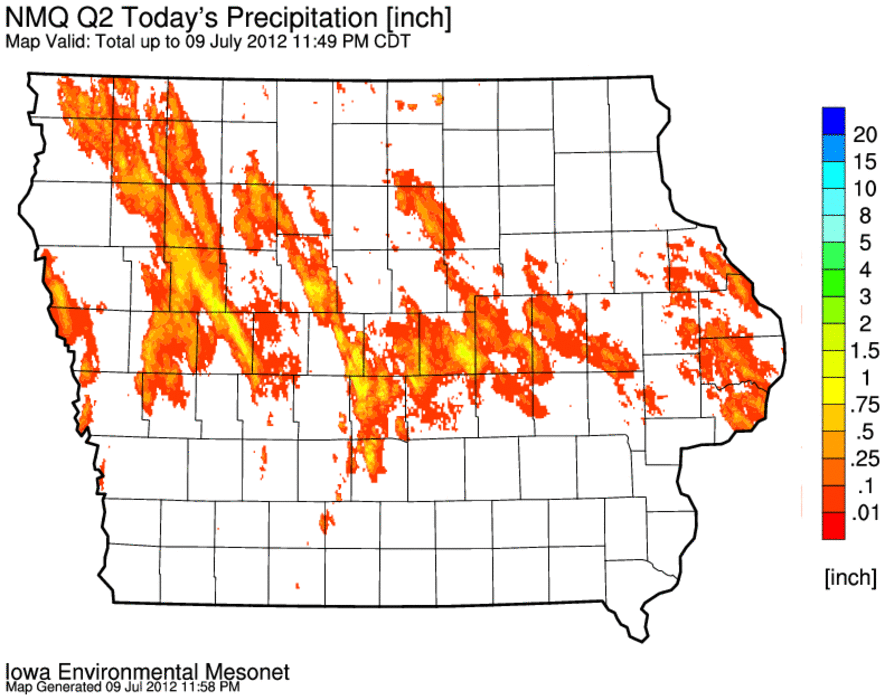
Rain has been difficult to come by this growing season, so for the
lucky few in the state that got rain on Monday, they should feel lucky!
The featured map is estimated rainfall totals from the NMQ project
showing the isolated nature of the heavier totals. Every little bit of
rain counts, but the little bits will be hard to come by in a forecast
that is mostly dry this week.
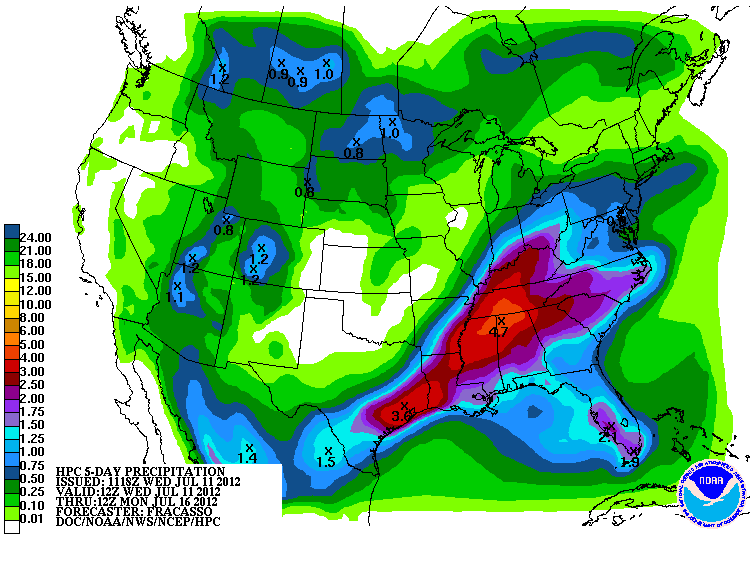
The featured map is forecasted precipitation for the next 5 days from
the Hydrometeorological Prediction Center. Most of the western corn
belt is shown to receive very little rain. The corn and soybean crop
is certainly under significant stress for most of the region due to the
hot temperatures and lack of rainfall.
The big story this summer continues to be the lack of rainfall. The
featured chart presents daily rainfall and accumulated departure from
average along with the average accumulation for Cedar Rapids. Deficits
are now around 7 inches for the growing season. Slight chances of
thunderstorms are in the forecast, but probably nothing that will make
up this deficit anytime soon.
The US Drought Monitor is updated weekly providing an analysis of
drought conditions for the country. This week's update has the entire
state covered by at least abnormal drought conditions. The featured
graph shows the areal coverage of drought conditions over Iowa. The
worst conditions are analyzed at "D2 Severe" level over east central
Iowa.
The featured chart displays year to date values of average temperature
for each year since 1880 for Des Moines. The red line is the year to
date for 2012 and you can see that it is well above any of the previous
years since the middle of March. The black line is climatology and the
purple line is for the warmest year, 1931. As a thought experiment,
the blue line represents this year but with the data for March swapped
out for average values. So the blue line is what this year would have
been like if we had an 'average' March. You may recall, temperatures
in March absolutely destroyed any previous average temperature records
for the month.
In the summertime, overnight thunderstorms provide a majority of the
total rainfall in Iowa. The featured chart presents the hourly total
rainfall for this year and the climatological value for the past 70
years or so. There has not been much rainfall during the midnight to 8
AM period. This rainfall typically comes from thunderstorm complexes
that develop over Nebraska and South Dakota in the late evening and
roll into Iowa overnight dumping heavy rainfall over wide areas.
Instead, most of our rainfall this summer has come from mid-afternoon
thundershowers that have been hit or miss for many in the state. If
there is any good news, it is that some areas have seen some much
needed rain, but much more is needed to save the corn crop.
The month of July 1936 is easily the warmest month on record for Des
Moines. Records are meant to be broken and this July has certainly
taken a run for its money at this record. The featured chart presents
the daily high and low temperatures for this July and 1936. The
running monthly average temperature is shown as well. This year (red
line) actually started off warmer than 1936, but the 15 straight days
above 100 in 1936 certainly set a high bar to exceed. So can this July
break the record? The green dots represent a minimum scenario of
having daily high temperatures at 98 and low temperature at 78. Such a
scenario for each day for the rest of the month would nudge this year
above 1936. It does appear unlikely this will happen, but 2012 will
have a good chance of finishing the second warmest month on record.
While the thermometer hit 103 degrees at the official observation site
in Des Moines (the airport ASOS), it was 6 degrees cooler a handful of
miles north in Ames as it only reported a high temperature of 97. The
featured chart shows the daily maximum temperature from these two sites
for July along with the maximum reported dew point for the day. Why is
Des Moines always warmer than Ames and Ames not having reached 100
degrees yet? Location is everything. The Des Moines airport is
surrounded by an urban landscape on most sides, while the Ames site has
mostly corn and soybean fields nearby. Agricultural areas promote
higher humidities due to crop transpiration, while urban areas are
comparatively drier. This difference is clear from the difference in
maximum dew points. The micro-climate around the Ames site is much
more humid, which means it takes more energy to heat the air. So for
the same incoming radiation, it will take more energy to raise the
temperature one degree at Ames versus Des Moines. There is also a
general urban heat island effect that happens moreso in Des Moines than
Ames, due to intensity of the urban landscape promoting warmer
overnight temperatures (all of the buildings and concrete hold heat
better than vegetation and topsoil).
The exceptional warmth of 2012 has certainly continued during July.
Even with northerly winds on Thursday, temperatures were still able to
reach the 90s for most of the state. What are the chances that this
year will be the warmest on record? The featured chart presents the
combination of the current year-to-date average temperature along with
the rest of each year previously back to 1880 for Des Moines as a
potential scenario. This year could certainly continue to be unlike
any other previous year, but for the sake of argument we will assume it
repeats like some previous year. With these scenarios, 64% of the
previous years would help us to finish as the warmest year on record.
So while the current year-to-date lead is very large, there is time to
lose ground. This chart would also indicate that this year should
remain warmer than the warmest on record until mid November at the
earliest.
Our extremely warm and dry summer continued to roll along this past
weekend with mostly dry continues and high temperatures topping 100
degrees for some locations in the state. Just how extreme has this
growing season been? The featured chart presents the combination of
statewide precipitation departure along with average temperature
departure since the first of May. The unit of measure is sigma (one
standard deviation from average). This convention allows a somewhat
equitable comparison between temperature and precipitation departures.
The circle on the chart represents an equidistant line that passes
through 2012. Only four other years show up as more extreme than this
year and they are all well known to Iowa's climate history.
Monday was yet another scorcher in Iowa with high temperatures near or
above 100 degrees. Des Moines hit 105, which set a new daily record.
The featured illegible table shows the hourly temperature reports for
Des Moines on Monday and the last date in the observational record with
a temperature as warm as that for the site. For example, the 102 at 1
PM was the warmest 1 PM temperature since 14 July 1936! Temperatures
this Tuesday morning are starting off very warm again, so we may
challenge these values today and again tomorrow. The good news is that
cooler weather is expected after Wednesday along with some chances of
rain.
Hot days have been "a dime a dozen" this summer, but hopefully the
grand finale is in store today. The featured map presents NAM model
forecasted 2 meter above ground air temperatures for 4 PM this
afternoon. Most of the state is shown well above 100, with some
locations pushing 110 and close to all-time record high temperatures.
The model has been running warmer than reality recently, so these
values probably represent a theoretical max moreso than the actual high
temperatures today. The good news is that cooler air will enter the
state tonight and highs for at least the next few days will be closer
to average for this time of year.
A common question asked this summer is how does this year compare with
previous drought years, like 1988. While there is no easy nor correct
answer to this question, we can certainly try different methods. The
featured chart presents three time series of accumulated temperature
and precipitation departures for the May through August time period.
The year 2012 compares closely with 1988 at the current date of the
year, but will it finish in a similar fashion? The current date
precipitation departures from 1 May are some of the worst on record, so
is this year worse than the epic years of 1934 or 1936? The
temperature departure in the top chart has 1934 and 1936 with substantial leads over 2012. 1977 is thrown in as it was a significant
drought for some in the state, is it worse than 2012? The bottom chart
presents the distance from a zero temperature and precipitation
departure, again there is no clear cut answer.
Rainfall once again fell on the state Wednesday and Thursday thanks to
the passage of a "cooler air than record highs" front. Unfortunately
damaging hail and gusty winds also accompanied the rain, but beggars
can not be choosers at this point. The featured map is an estimate of
rainfall based primarily on Doppler Radar. There are some areas that
completely missed out and others that got over two inches of rain.
There are chances of rainfall in the forecast for this weekend before
another stretch of dry weather is expected next week.
The past seven days have seen the return of much needed rainfall in the
state. The featured map presents an estimate of rainfall over the past
seven days along with last week's national drought monitor. The entire
state is in D2 "severe" condition with some locations in eastern Iowa
in D3 "extreme" condition. While extreme eastern Iowa did miss out on
most of the rain, some portions in the D3 analysis got 1-3 inches.
Unfortunately, the forecast for this week is once again dry with the
best chances of rain over northwestern Iowa.
This feature continues the series of comparing how the drought this
growing season stacks up with previous years. For this metric, an
estimated areal coverage of Iowa is presented that had a previous
thirty day period with less than two inches of total rainfall received.
This arbitrary metric attempts to show the breadth of dry continues and
how it changed over the period. The top chart presents the daily
coverage for this year and four previous years of note. In this
comparison, 2012 shows up much worse than 1988 in late July, but better
in late June. The middle chart presents the simple average of the
value over the June and July period and 2012 has the highest value
around 60% since the year 1900 followed closely by 1988. The bottom
chart looks at this value during a key period for corn development in
mid-July. 1936 is easily the largest average coverage as shown by this
metric. So the question remains unresolved, how does this year compare
with previous drought years? Is it worse than 1988?