Temperatures soared on Thursday well into the 90s. Dew point
temperatures were in the mid to upper 70s as well making for a
miserable time outside. The featured chart presents some details on
the days when the temperature has reached 100+ degrees for Des Moines.
The top chart shows the morning low temperature on the days when the
temperature topped 100 and the bottom chart shows the times during the
afternoon that 100+ degrees were reported. Low temperatures are
typically in the mid to upper 70s and the warmest temperatures occur
during the mid afternoon.
The featured chart presents the daily temperature time series for each
day the Des Moines Airport sensor was over 100 degrees. The blue lines
in the plot indicate days on which rainfall was also reported. Having
rainfall on 100 degree days is rather rare, which is probably an
indication of having very warm air overhead that prevents thunderstorms
from forming while helping to rapidly warm our temperatures.
The fourth of July has been a spectacular day in Iowa with warm
temperatures and pleasant humidities. The featured satellite image only
shows a few clouds over southwestern Iowa. Looks to be a great evening
for fireworks in Iowa.
This growing season has seen its share of warm and cool weather, but
the result has been an average accumulation of growing degree days. The
shortened work week ahead looks to be about average as well with a good
bit of sunshine. Have you taken the opportunity to go listen to and
watch the corn grow? :)
A severe thunderstorm developed over northcentral Iowa Tuesday
afternoon and marched mostly south. This storm motion is not what we
typically expect in Iowa of west to east moving storms. When the NWS
issues severe thunderstorm warnings, they include a storm motion. The
featured chart summarizes these storm motions issued by NWS offices
with jurisdiction over Iowa. The upper chart presents a comparison
between storm direction and date of year. It shows the favored
direction of travel from the southwest in June to more west-
northwesterly in July. The bottom chart compares storm speed with
direction of travel. The fastest storms are clearly from the southwest
with the largest concentration around 30 knots from the west. So our
storms from the north-northwest on Tuesday are a bit rare, but not
nearly unheard of like storms travelling from the east to west!
Following up on yesterday's feature, today's looks at a comparison of
tornado warned storm motion versus the severe thunderstorm warnings
near in both space in time. Sometimes the sign of a storm that can
produce a tornado is when the storm's path deviates from others around
it. Typically, this deviation is a slight turn to the right (called
right turners). Based on forecasted storm motions, just slightly more
than half of the storms exhibit some bit of right turning. Another
aspect to "right turners" is a decrease in speed as the storm's
circulation strengthens. Again, just over half have forecasted speeds
below those of warned severe thunderstorms around it. This is by no
means an exhaustive look at this topic, but hopefully an interesting
chart nonetheless. The bottom chart does contain an interesting dual
maximum (25kts and 40kts) that may be a sign of a separation between
isolated supercells (slower speeds) with linear convective complexes
(typically faster moving).
The past five days have seen not much wind to speak of with daily
average values for Ames in the 2-4 mph range. The featured chart
presents the daily average wind speed since the first of June. The
third of July was one of the least windy for the entire year. The
forecast does increase our wind speeds along with more chances of rain.
The damage reports are rolling in after a powerful storm system plowed
through Iowa early this Monday morning. The hardest hit areas are
from north of Des Moines to Dubuque as shown by the summary of local
storm reports from the NWS. Some of the damage reported this morning
is significant from winds probably upwards of 100 mph.
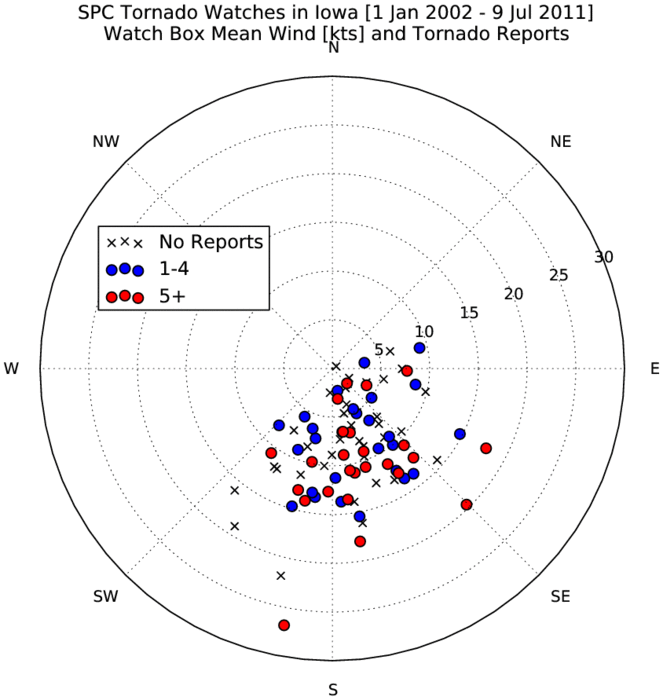
The featured chart presents an analysis of averaged surface wind speed
and direction over the domain of a Storm Prediction Center issued
tornado watch that was centered over Iowa. The wind values are for a
period near issuance. The symbols represent the number of tornadoes
reported within the watch box. The plot nicely shows that winds from
the southeast to southwest are the most common with a sharp cutoff at
the southwest direction. Tornadoes form in environments of wind sheer
where wind speeds and/or direction change with increasing height in the
atmosphere. So having surface winds out of the southeast and upper
level winds out of the west provide the sheared environment in Iowa.
The cleanup continues from the high wind event on Monday morning. The
featured title typically refers to having the radar beam hitting
objects on the ground, but in this case the actual radar hit the
ground. WHO-TV (of Des Moines) had their radar blown off its tower by
the storms Monday morning. The photo is of their RADAR radar dish on
the ground. Earlier this year, WAFF-TV's (of Huntsville, AL) radar was
destroyed by storms there.
The featured chart presents daily precipitation totals and the
departures from average for the Cedar Rapids Airport sensor. Rainfall
this month has been not been widespread and most of eastern Iowa has
missed out on the heavier events. There are more chances of rain in
the forecast, but this weekend looks to start a very hot and dry period
in the state.
The big story is the forecasted upcoming hot weather to begin this
weekend and last into at least next week. The featured chart presents
the number of hours per year that the heat index was observed to be at
or above 100 degrees at the Des Moines sensor. The 2011 total is
already above four of the past seven years. This weather will be right
on time for the climatological warmest week of the year as well.
Heat index values soared to well over 100 degrees this past weekend
thanks to highs in the 90s and dew point readings in the upper 70s and
lower 80s. The featured chart presents frequency of having a 100+ heat
index by hour and week of the year based on observations from the Des
Moines sensor. The bullseye is right about now, the third week of July
which is also the warmest week of the year. The very hot weather looks
to continue this week.
Yesterday was another very hot day in Iowa with high temperatures
nearing 100 degrees. It was the fourth day in a row with a high
temperature over 90 for Ames. The featured chart presents the yearly
maximum daily streak over 90 degrees for high temperature for Ames.
Some years, like 2004, the temperature never got that warm for the
entire year! Our current streak has a chance of being the longest we
have seen in around 20 years.
The featured chart presents an hourly climatology of temperature, heat
index, and humidity (mixing ratio) in July for Ames along with the
observations from Monday. The mixing ratio is a measure of the amount
of water within a unit mass of dry air. The top chart shows average
mixing ratios in the 12-14 range, whereas observations on Monday were
in the 19-24 range (blue line). Notice what happens in the last
afternoon around 6 PM. While the air temperature was flat for the
afternoon, humidity levels kept rising and pushed the heat index well
above 110 degrees. This effect was probably heavily influenced by all
of the corn transpiring water throughout the day. The hot and muggy
weather will continue today.
Our recent stretch of extremely hot and muggy weather has gotten Iowa
a bit of publicity as some of our automated stations have calculated
heat indexes that exceeded 130 degrees! Typically, this is blamed on
the abundant transpiring corn crop in the state, but that is not the
entire story. The primary source of automated weather data in the
state are located at airports, but there are two classes of
instruments. The federally administered ASOS sites have higher
quality and sometimes different sensors than their state run AWOS
counterparts. Unfortunately, their data is typically thrown together
in the same pot and reported as such. While the ASOS sites did
indicate gaudy heat indexes exceeding 110 at times, they were not as
high as the AWOS sites which got all the headlines. The featured
chart presents a comparison of an ASOS and AWOS site separated by 30
some miles and both surrounded by farm fields. The bottom plot raises
the most doubt as even while visibilities were at 2-4 miles, relative
humidity was just 75% at the AWOS site and near 100% at the ASOS site.
This is probably an indication that the AWOS air temperature has a
warm bias. The second plot shows another issue of having the AWOS dew
point rise dramatically during the morning hours at a much higher rate
than the ASOS site. It is hard to imagine a natural process that
could be putting that much water into the atmosphere in the early
morning hours. The first plot of the ASOS site shows a reasonable
depiction of transpiring corn (slowly rising dew point throughout the
day peaking late afternoon coinciding with plant transpiration), but
the dew point temperature barely gets to 80 degrees which keeps the
calculated heat index at reasonable values. The moral of the story is
that not all automated sensors are alike and while heat indexes over
110 surely were felt in Iowa these past days, the high end values over
120 are questionable.
With budget deficit talks in Washington dominating the news, some in
Iowa are dealing with their own deficits in the form of lack of
rainfall. The featured chart presents the four month departure of
rainfall from average. The northeastern quarter has been the driest
portion of the state. These totals do not include the heavy rainfall
falling this Friday morning. This rainfall is coming just in time with
corn at pollination stage.
Friday's rainfall was a very welcome relief to some areas of the state
that have been on the dry side this year. It also came at a perfect
time for the pollinating corn crop in the state. The featured chart
looks at how proportional the rainfall was over areas that needed it
the most. Indeed, the heaviest amounts fell more proportionally over
the areas with the deficits. The top chart shows the portion of the
area with a deficit that got over an inch of rain. So over half of the
area with a 3 inch deficit since March got over an inch of rain! The
bottom chart is simply the average rain over the area with a given
deficit.
Our atmosphere has been loaded with water recently. When storms form
in this environment, they can become very efficient rain producers and
dump extreme amounts of precipitation quickly. During just Saturday
morning, the weather sensor at the Chicago O'Hare Airport recorded
their largest daily rainfall total on record. The featured chart
presents the one minute interval precipitation data from the weather
sensor and shows computed rainfall rates measured over various
intervals of time. The rates over 1 and 15 minute intervals are
extrapolated out over the hour for comparison. The actual hourly rates
are shown in red. For a minute by minute basis, rainfall rates once
exceeded 8 inches per hour (0.14 inches reported in one minute)!
This July has been one of the warmest we have seen in a very long time.
As measured by average daily low temperature, this year comes in second
behind 1936 based on IEM statewide estimated data as shown by the
featured chart. Years above average are shown in red and the 1930s
really stand out. One reason why overnight lows have been so warm is
the vast amount of moisture in the air this month (more on this
tomorrow). The warm weather is expected to continue until the end of
the month.
This month has seen a remarkable amount of humidity in the area as
shown by the featured chart comparing average mixing ratio for July
since 1951 at the Des Moines Airport. Last year had been the
previously most humid for July, but this year has soundly beat it by a
full gram! Of course, there is still a few days left in this July, but
judging by the forecast, the sticky weather looks to stick around until
the end of the month.
The warm and muggy July rolls on with low temperatures again in the mid
to upper 70s this Thursday morning. The featured chart presents the
daily high and low temperature percentiles so far this month. The low
temperatures really stand out with most of the days this month shown
well average and near the 100th percentile. The forecast for the rest
of July continues this trend with only slightly cooler overnight
temperatures expected until this weekend.
Just a few days ago, the Chicago O'Hare weather sensor set a local
record for daily rainfall total. This time it is Dubuque's turn. The
featured chart displays the one minute interval precipitation data from
the Dubuque Airport weather sensor. The hourly rainfall rates are
presented looking over various windows of time. On a minute by minute
basis, the extrapolated hourly rates exceeded 10 inches per hour (0.19
inches in one minute)! Needless to say, this amount of intense
rainfall caused a lot of problems in the area. Other (non-official)
weather sensors in the area reported upwards of 14 inches of rain from
this event!