Iowa has gone from drought conditions to flooding with the wettest
spring on record. Mason City has already received more precipitation
this year (21.42 inches) than all of last year (20.42 inches)! The
featured chart presents the date of the year when the total precip
exceeded the total from the previous year. This condition does not
happen every year, so those years have no value plotted. This year
beats any other year by 30+ days!
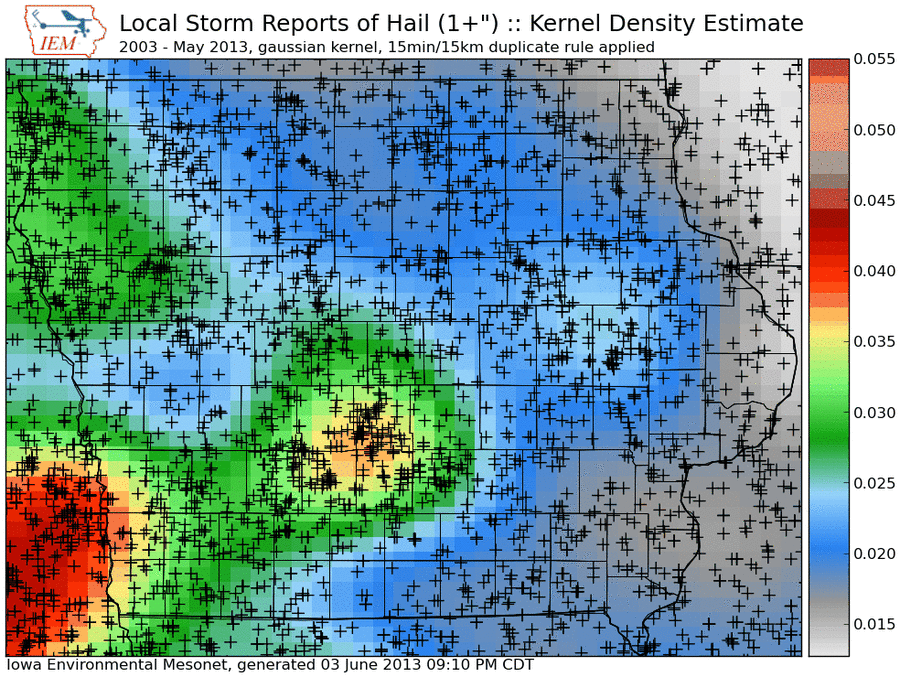
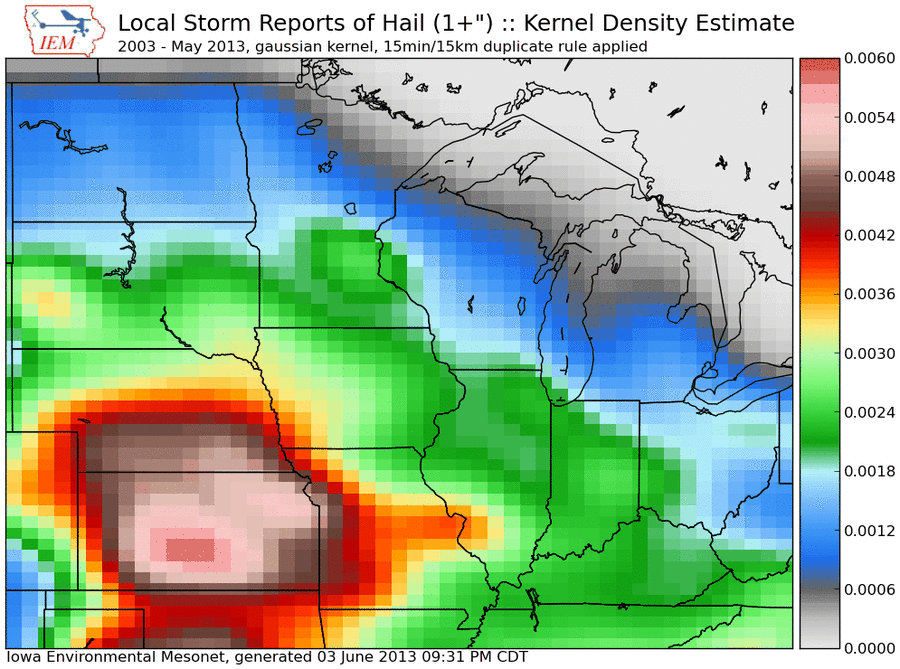
The featured map presents an analysis of National Weather Service Local
Storm Reports (LSRs) of one inch plus diameter hail since 2003. The
analysis is a kernel density estimate using a Gaussian kernel and
attempts to show the spatial distribution of hail reports. Hail is
reported and collected by humans, so it is natural to see urban centers
in the state show local maxima for reports. The general pattern is for
fewer reports as one travels from southwest to northeastern Iowa. The
geography of the Midwest drives the meteorology which favors more
instability over the plains. This instability feeds thunderstorm
development in the late afternoon hours that tends to produce hail.
These thunderstorms then truck it east, congeal and loose their ability
to produce hail.
This featured chart presents the number of days this year, last year,
and on average that the daily high temperature was within the given
temperature range. This year has seen one more day in the 50s than
last year, but that is because there were so many more days last year
warmer than that level. The 80 to 90 degree level really tells the
story as this year has seen 21 fewer days in the 80s than last year and
is about half of long term average. The forecast looks to continue the
cool weather and perhaps we'll be back in the 80s next week.
Temperatures struggled to reach 70 degrees again yesterday in Iowa.
June has gotten off to a cold start with the highest temperature
reported by Des Moines so far of only 72 degrees. The featured chart
presents the range of daily high temperatures for Des Moines for the
first five days of June. Only 1903 and 1927 got off to a colder start
of only 71 degrees. Interestingly, this year is tied with 1993! Of
course, that was the great flood year in the Midwest. The forecast
does hold hope that we may hit 80 degrees next week.
Besides the commonly displayed reflectivity and velocity presentations
of RADAR, the NWS NEXRAD system is also running algorithms on this data
attempting to identify and track storms. This information is
disseminated as a product called Storm Attributes Table and comes with
every volume scan. The IEM archives this product and the featured
chart presents a summary of this information from the Des Moines
NEXRAD. The histogram presentation shows the most common combinations
of storm speed + motion and motion + day of the year. The vast
majority of storms have a motion from the southwest moving to the
northeast at a speed around 20-40 mph. The bottom chart shows the
annual cycle of storm motion in Iowa. Storms transition from coming
mostly from the WSW to WNW by late July and then back to mostly WSW.
The physical reason is due to the synoptic scale flow patterns that
change with the seasons.
The cool start to June has not helped to recover the growing degree day
deficit that has built up so far this growing season. The featured
chart presents the 1 May to 9 Jun GDD departure and then the change in
this value to finish the growing season on 1 Oct. There have been a
few years with a slower start to GDD accumulation and still finish the
season above average. The forecast for this week at least has our
temperatures in the 80s instead of struggling to reach 70 that we have
experienced so far this June.
Getting the crops planted this year has been a major struggle after a
snow event to start May, cool temperature, and frequent rain events
since. The featured map is an analysis of the maximum time period in
between hours with at least 0.05 inch of precipitation. Restating, the
longest we have gone since 1 May in between rain events. The region
with the most difficult time planting this season clearly shows up from
northcentral Iowa up through central Wisconsin. Areas around La Crosse
are shown in the 5-6 days range. Most of the corn is finally planted,
but soybeans are still way behind. The near term forecast has chances
of heavy rainfall for these same areas.
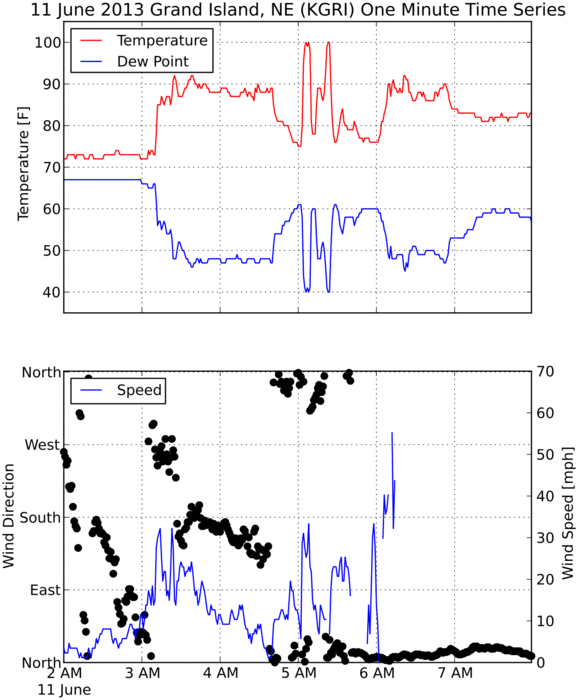
Portions of southcentral Nebraska experienced an intense heat burst
event during the early morning hours on Tuesday. The featured chart
presents one minute interval observations from the Grand Island,
Nebraska ASOS. Heat bursts are caused by decaying thunderstorms
driving very warm and dry air to the ground. The classic signature is
a rapid rise in temperature along with a rapid drop in dew point. The
chart appears to show four heat burst events with the two after 5 AM
being extremely intense as the temperature goes from the 70s to 100
degrees in a few minutes. These events tend to also bring gusty winds
with some gusts over 50 mph reported in the area.
A number of tornadoes were observed in Iowa yesterday and the featured
image is the result of one in Belmond, Iowa. That tower with weather
instruments on it should be on the top of the school in town, but the
tornado thought it looked better laying sideways on the ground.
Fortunately, there were no injuries in town reported with this tornado
and unfortunately, the sensors did not record any interesting data as
the tornado passed by. More severe weather arrives tomorrow and for the
weekend.
Farmers struggled to get the corn planted this growing season due to
cold temperatures and wet conditions. Since most plant corn before
planting soybean, it is obvious that the planting progress for soybean
is well behind average for most states. The featured map displays the
USDA reported soybean planting progress as of 9 June compared with the
average value for the second week of June. Iowa and Wisconsin are the
furthest behind average. These values do not tell the entire story as
it is hard to account for all of the acres that were drowned out and
will need to be replanted. Also there will be some fields abandoned for
the year. Unfortunately, more rain will fall today and this weekend.
The featured chart displays estimated areal coverage of at least 0.05
inches of daily precipitation for Iowa since 1 April. The past 31 days
have only seen four completely dry days in the state as Sunday was.
The forecast for this week calls for mostly dry conditions. It is
summertime though, so you can never completely rule out late afternoon
to evening showers.
Skies were mostly clear on Monday allowing mid June sunshine to nicely
warm us into the 80s and even 90s. Humidity levels were very
comfortable with afternoon dew points in the 50s. Des Moines reported
a 90 degree temperature along with a dew point in the lower 50s. The
featured chart presents the frequency of a given afternoon temperature
having a sub 55 degree dew point in the top chart and the daily
frequency of such dew points overall. The 90 degree temperatures comes
with about 10% probably, so our weather yesterday was certainly not the
norm. The humidity is scheduled to return later in the week with heat
indices near 100 degrees.
The Heat Index has not been a prominent topic so far this summer as
temperatures have been cool and the warm days have mostly seen limited
humidity levels. The featured chart attempts to provide a climatology
for heat index for Des Moines. The contours on the plot are the
temperature difference the heat index is from the air temperature. For
example, at 90 degrees and 50% relative humidity the heat index adds
two degrees to the temperature. The color pixel values are the
relative frequency of the given relative humidity at the given
temperature, meaning that each column has a sum of 100%. The point of
the plot is to show the most common combinations of temperature and
relative humidity along with the heat index that produces. Thankfully,
as the temperature increases the relative humidity tends to decrease
which limits the heat index (the water content of the air does not
change only the water holding capacity). The chart also indicates that
the heat index is rarely adding over 14 degrees to the temperature and
typically something less than 6 degrees. The forecast has some of the
warmest heat index values of the year so far set to arrive this
weekend.
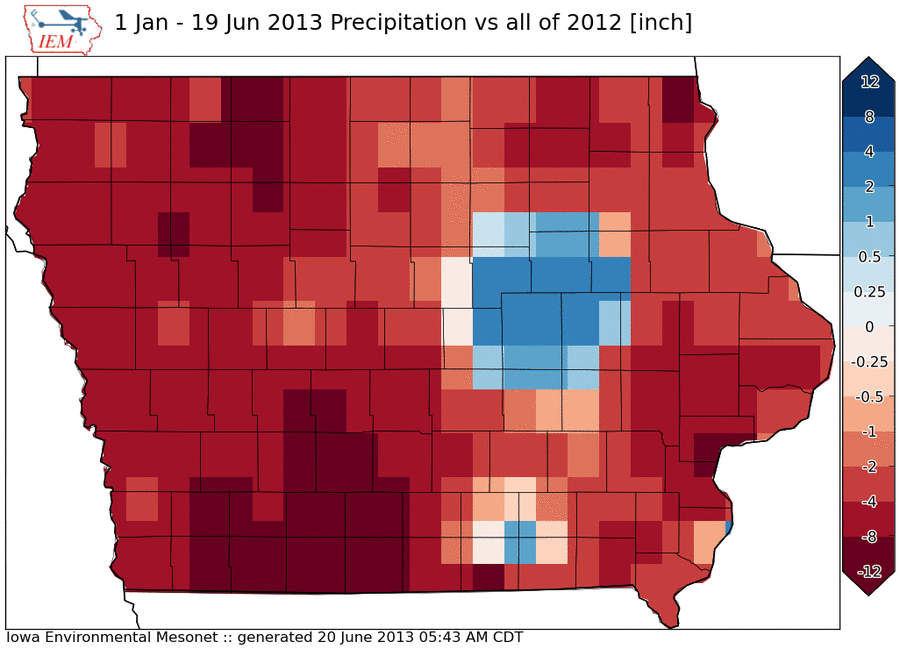
While we have yet to reach the half way point of 2013, the
precipitation totals have already eclipsed the 2012 totals for some
locations in the state as shown by the featured image. The largest
differences are shown in an area south of Waterloo. This year
experienced a wet winter season followed by the wettest spring season
on record. The result has nearly eliminated the drought in Iowa (only
some dryness in northwestern Iowa).
It is somewhat ironic that the first day of summer also is the first
day with shortening daylight time. The featured map shows the
idealized change in daylight time from Friday to Saturday. Iowa will
loose just over four seconds! Of course, this change accelerates as
the summer moves along. The start of the summer season will also
feature some of the hottest and muggiest weather we have seen so far.
The featured map presents 72 hour precipitation estimates from the NOAA
NMQ project centered over NE Iowa and SW Wisconsin. This area has seen
numerous rounds of intense thunderstorms and some places are estimated
to have received over a foot of rain in the past 72 hours. This has
created dangerous flooding in the area. Unfortunately, more
thunderstorms are in the forecast just about every day this week.
A heat burst event occurred in Iowa on Sunday morning with the classic
signature of having the temperature rapidly rise and dew point fall at
the same time along with an increase in speed. The featured chart
shows the heat burst event at the KCCI-TV schoolnet site in
Farnhamville (near Fort Dodge). Please note that the 92 mph wind gust
reported at the site is probably due to the sensors high location on
top of a building. The wind sensor is not at a standard 30 foot and
unobstructed height. These events are caused by rapidly decaying
storms that drive a layer of warm air to the surface that warms even
more thanks to the ideal gas law (increase in pressure leading to
increase in temperature).
The featured chart displays two daily frequencies of tornado and severe
thunderstorm warnings in the United States. The green bars are the
percentage of years since 2002 that at least one tornado or severe
thunderstorm warning occurred on. The blue bars are the simple average
number of total warnings issued per day. So while the number of
warnings peaks in mid June, just about every day during the summer
season sees severe weather somewhere in the US. In fact, this chart
shows there has not been a day in July without severe weather since
2002. More severe weather is possible today in Iowa along with
continued heavy rainfall events.
The main goal of the IEM is to archive data and then provide that data
for download on the website. The featured chart displays the daily
archive size of the imagery and data files stored. Some labels are
shown when new datasets were added to the archive routine that
significantly increased the daily archive size. The current daily
archive is around 15 gigabytes in size, which is many times greater
than that of just a few years ago. Thankfully, data storage continues
to decrease in cost and the ability to archive many terabytes per year
is tenable.
The National Weather Service RADAR network (NEXRAD) is constantly
sampling the atmosphere and sensing objects that reflect its
transmitted energy. The NEXRADs also measure the doppler shift of the
reflected energy to provide an estimate of the reflected particles
speed toward or away from the RADAR. Algorithms run on this
information and organized storm motions are diagnosed. The featured
map shows the location of tornado vortex signatures (TVS) diagnosed
from the five RADAR sites covering the state. The TVS reported from
the NEXRAD is a indication of a storm capable of producing or is
already producing a tornado. Due to physical mechanics of doppler
RADAR, these signatures can only be diagnosed at a range close to the
RADAR. On the map, you'll notice many areas in Iowa without any
reports. The reason is not that they don't have any tornados, but they
are too far away from the closest RADAR for the algorithm to work.
Our recent bout with muggy weather looks to be taking a respite in the
coming days. The featured chart presents the longest periods of having
a dew point at or above the given temperature based on hourly
observations from Des Moines. For example, back in 2011 the dew point
was above 65 degrees for nearly 40 days straight. The upcoming drop in
dew point will help limit heavy rainfall events as we really need to
dry out in the state.
An intense thunderstorm complex brought high winds to bear on Wichita,
Kansas Thursday evening. A heat burst event followed shortly
thereafter. The featured chart presents one minute interval
temperatures and pressure from the Wichita Airport sensor. The classic
heat burst signature is clearly shown as the rapid increase in
temperature is paired with a rapid decrease in dew point. This is a
result of very warm and dry air rushing to the surface. Click on the
'heatburst' tag shown with this feature to view other events the IEM
has documented in recent years.


