The last day of May saw a remarkably cool and drizzly day. The Des
Moines ASOS weather sensor reported measurable precipitation for 15 of
the 24 hours during the day. The featured chart presents the frequency
of hourly reports of precipitation per day of the year based on hourly
reports back to 1933. There is a clear signal in this chart showing
maximums in precipitation duration in mid spring and late fall. These
are common times for large storm systems that could produce
precipitation over longer time periods than summer when our weather is
dominated by smaller scale storm systems and individual thunderstorms.
One caveat to this plot is that our summertime storm systems frequent
the state in the late evening into the next morning, so their time
totals would be split over two days moreso than other times of the
year.
The meteorological spring season (March, April, May) is complete and
for average temperatures it was easily the warmest on record. The
featured chart presents the spring season average high, high+low, and
low temperature for each year since 1893 for Iowa. 2012 was not only
the warmest year on record for this period, but by a rather large
margin. This was thanks to the epic warmth in March. Our recent
stretch of weather has seen its share of cooler than average days and
the forecast for this week has us in the upper 70s and lower 80s for
high temperatures.
Our recent stretch of weather has been on the dry side for most in the
state. The month of May and spring season was below average as well
for most. Is a dry summer season in store for us this year? The
featured chart compares the spring season and May total precipitation
against the resulting summer season precipitation. Any year above the
blue line would have been above average for the combined period. The
red line shows this year's total for comparison with other years. The
good news is that our odds do not appear to be too small to get a wet
summer season by these two metrics. The bad news is that the near term
forecast is not that encouraging for heavy rainfall events.
The proverb "you have to take the good with the bad" may apply to
rainfall that comes along with thunderstorms in Iowa producing severe
weather. How much do these severe thunderstorms contribute to Iowa's
total rainfall? The featured chart presents the contribution of yearly
rainfall totals for Des Moines during time periods under which the
airport was under either a severe thunderstorm or tornado warning, the
period including the hour before and after severe weather, and the rest
of the year. The +/- hour period does not include the warning period
or any other warnings that may have been active at the time. This
chart is based on the one minute interval precipitation observations.
Based on this data, these thunderstorms generally bring around 10% of
the yearly total of precipitation. The severe thunderstorm
contribution so far for 2012 is much higher due to an intense storm
back on 14 April and the limited data so far this year.
Rainfall has been difficult to come by these past few weeks with
accumulated departures since the first of May running in the 1-3 inch
range for most of the state. The featured chart presents an IEM
computed analysis of precipitation departure since the first of May.
Some locations to our southwest and southeast are certainly in worse
shape than we are currently. The immediate term forecast does not hold
much hope for widespread and heavy rainfall.
The United States Drought Monitor is an analysis of current drought
impacts put together by a team of scientists. Thanks to a mostly dry
May and a dry start to June, the situation in Iowa is rapidly
deteriorating. The featured chart shows the history of drought
designation coverage in the state since the start of 2011. Unlike last
year, where there was near no drought to start the beginning of the
growing season, this year is going into summer with dry conditions
covering most of the state. The prospects for heavy rainfall continue
to not look very good.
The world's oceans are a major source of water vapor in our atmosphere
which leads to precipitation over land. Being well inland within a
continent, Iowa's main source of moisture in our atmosphere comes to us
thanks to Gulf of Mexico. By looking at prevalent wind directions for
observation sites near the coast like Beaumont, Texas, we can get an
approximation of how much of the surface air flow is coming inland off
of the ocean water. The featured chart presents the frequency of
having on-shore flow at this point in Texas against the precipitation
total for the month of June here in Iowa. The implication is that by
having more on-shore flow, our moisture supply will increase and lead
to more precipitation in Iowa. The chart mostly verifies this, but our
precipitation is not as simple as looking at wind flows off of the
gulf. Certainly, this metric provides some insight into the
atmospheric circulation regime that may help to enhance our
precipitation. The value so far this June is presented and would
somewhat support the notion that our flow of moisture off the gulf has
been limited somewhat this year.
Our most recent rain maker this past weekend brought much needed
rainfall to much of Iowa. The featured map presents an estimate of
total rainfall for the event. Some places in southwest Iowa and around
Waterloo have estimates over an inch of rain. Times are starting to
get more desperate for needed rain to keep the crops in the state
happy. The forecast does not look optimistic for chances of rainfall.
The featured chart presents the areal averaged statewide precipitation
estimate by the IEM since the first of May for each year back to 1893.
This year is one of the drier years on record for this period and the
driest since 2006. 2008 shows up as the wettest for this period and it
was roughly this date that the significant flooding in Cedar Rapids
started. The forecast does have chances of scattered storms, but
nothing like what happened back in 2008.
Featuring the lack of rainfall is the mostly logical thing to do when
our weather pattern continues to lack rainfall. The featured graphic
presents areal averaged daily rainfall accumulations for Iowa since the
first of May. Widespread and heavy rainfall has certainly been
difficult to come by, but some portions of the state (mostly
northwestern Iowa) have seen some nice rainfalls so far this growing
season. The forecast does have some decent chances of rainfall chances
on into the weekend, so hopefully the rest of the state gets caught up!
The featured chart presents a forecast model's prediction of 3 hourly
precipitation accumulations for a grid cell over Des Moines. Each row
represents a sequential model run and forecast out for eight days. The
white cells represent a time period outside the bounds of the forecast
temporal domain and pink cells represent a dry forecast. The columns
represent the change in the forecast over time and you can see a lot of
variability with the amount predicted. Some of the forecast runs
dumped considerable rainfall today and into this weekend, while others
are on the dry side. This model variability makes life fun for weather
forecasters. What will actually happen?
So far this summer season, we have avoided muggy stretches of weather
as shown by the featured chart of dew point temperatures since the
first of May. That will change this week with very warm and muggy air
in Iowa this Monday morning and sticking around most of this week.
High temperatures today are expected to be near record levels with dew
points around 70 degrees!
Temperatures soared on Monday well into the 90s and may have hit 100
degrees in some very isolated locations in southwestern Iowa. Hitting
100 degrees is not that common of an event in Iowa, in particular
within the recent few decades. The featured chart presents a crude
analysis of the frequency of daily 100 degree temperature readings for
Iowa. Southwestern Iowa is clearly the favored location along with
perhaps a secondary maximum over southeastern Iowa as well. Another
very warm day is expected today with highs again well into the 90s.
The featured chart presents the year of the last 100 degree observation
for the climate sites in the state. Particularly in northeastern Iowa,
it has been a number of years since the last time the thermometer
reached the century mark. 1988 is certainly a popular year for this
chart, which was a major drought year for the state. Our recent
flirtation with these extreme temperatures has come to an end with
highs expected back in the 80s for the rest of the week.
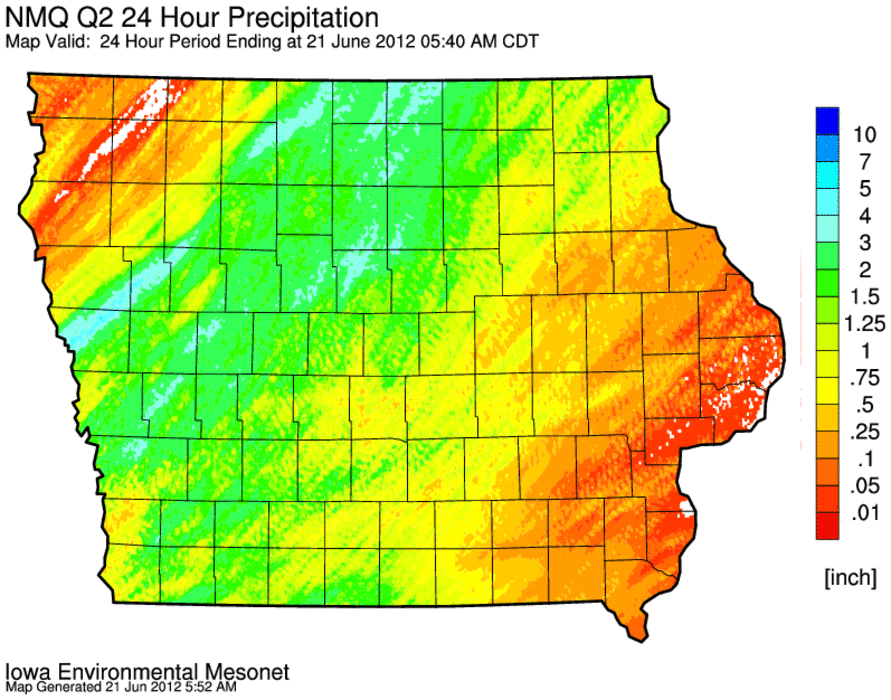
A slow moving front swept the state clean overnight of the hot and
muggy air. It also brought along some much needed rainfall as shown by
the featured image of rainfall estimates from the NOAA NMQ project.
Unfortunately, areas that needed the rain most in eastern Iowa missed
out on the heavier totals. Unfortunately the forecast looks mostly
dry, but temperatures will be cooler and less muggy.
The featured map presents estimates of rainfall since the first of May.
Most of the eastern half of the corn belt has been rather dry for the
growing season. Within Iowa, a stark contrast exists between the
eastern and western half of the state. The lack of rainfall during
this important time of year has some folks worried about the corn and
soybean crops. Unfortunately, the near term forecast does not look
very promising for this area.
A significant flood event impacted areas in and around Duluth,
Minnesota this past week due to heavy rainfall over a multi-day period.
The feature chart presents the one-minute interval precipitation
observations from the Duluth ASOS sensor. Total precipitation for this
event was nearly seven inches at this site. This rainfall caused record
river heights in the area and significant damage.
The hot weather is back with temperatures on Sunday into the lower 90s
over southern Iowa and expected to warm to near 100 degrees this week.
The featured chart presents the occurrences of 100 degree weather.
July is certainly the favored month of the year, but having this warm
of weather in late June is common as well. The bottom chart presents
the number of days per year that at least one site in Iowa reported a
100 degree high temperature. The Dust Bowl era and the drought of 1988
stand out in this plot.
The weather forecast models have been very enthusiastic for hot weather
on Wednesday. The featured map is one such prediction from the "NAM"
model showing 4 PM temperatures on Wednesday. A good chunk of the
state is shown in triple digits with values approaching 110 near Omaha.
These values are even a bit cooler than previous runs of the NAM model
were advertising! Of course, if models were truth there would be no
need for forecasters and forecasters somewhat doubt it will get this
warm on Wednesday. What is your prediction for a high temperature
tomorrow?
Today looks to be a very warm day with a high temperature expected to
reach 100 degrees for Des Moines! If this happens, it would be the
first time since 2006 for the site. The featured chart presents the
frequency of other sites in the Midwest hitting 100 degrees on the same
day Des Moines does. Des Moines itself shows up on the chart as 100%
for illustrative purposes. The general pattern is rather clear with a
southwest to northeast oriented axis of higher frequencies (more likely
that locations to Des Moines southwest will also be above 100 as well).
This region is a source of hot and dry air for Iowa, so it makes sense
that it would also be associated with the warmest temperatures. The
air mass arriving into Iowa has been destroying June and even all time
record high temperatures over the plains states. Is Iowa next?
The high temperature for Des Moines hit 101 degrees yesterday, making
for the first 100 degree reading since 2006. The featured chart
presents the number of days each year the temperature was in triple
digits and the highest temperature for that year. The 1980s were the
last period of a significant number of these really warm days. Of
course, the dust bowl period of the 1930s stand out on this plot as
well.
Very hot air arrived in Iowa on Wednesday and muggy conditions were not
far behind. With surface dew points near 80 degrees in some locations,
the lower atmosphere is loaded with moisture. This moisture represents
a potential energy source for thunderstorms as condensing water within
clouds releases heat which promotes upward motion. The featured map
presents a measure of this energy named convective available potential
energy (CAPE). CAPE values above 2,000 are often considered
significant for severe storms, so do the values shown above 6,000 in
Southern Iowa on Thursday evening mean the world is coming to an end?
The key word in the CAPE acronym is potential. Just as a watermelon
sitting on the top of a sky scraper has a high potential to accelerate
if pushed off the edge, the initial push needs to occur. For the
atmosphere, weak winds and little convergence of air often means these
profiles are left unrealized (nothing to give them a push).
Yesterday's daily feature noted the extreme instability that existed in
the atmosphere, but the lack of forcing to realize all that potential
energy. On Friday morning, a storm cluster was able to get organized
over Illinois and trucked it all the way to the eastern coast producing
hundreds of reports of wind damage and should easily meet the derecho
classification. The featured image shows a time composite of maximum
NEXRAD reflectivity for the event. You can see the path this storm
system took as it moved along the classic 'ring of fire' setup with an
extremely strong high pressure system to its south. Another cluster of
storms got going over Iowa Friday afternoon and caused damage in
eastern Iowa. These storms are able to create their own cold air mass
at the surface and then push it along providing the lift necessary to
realize the available potential energy.