May is now in the books and for growing degree days totals, it was
about on average for May. A warm stretch during the second week of the
month really helped to warm up the soils and get the crops going for
hopefully a good growing season. June is now here and so is the heat
with highs expected in the 80s to near 90 for the rest of the week.
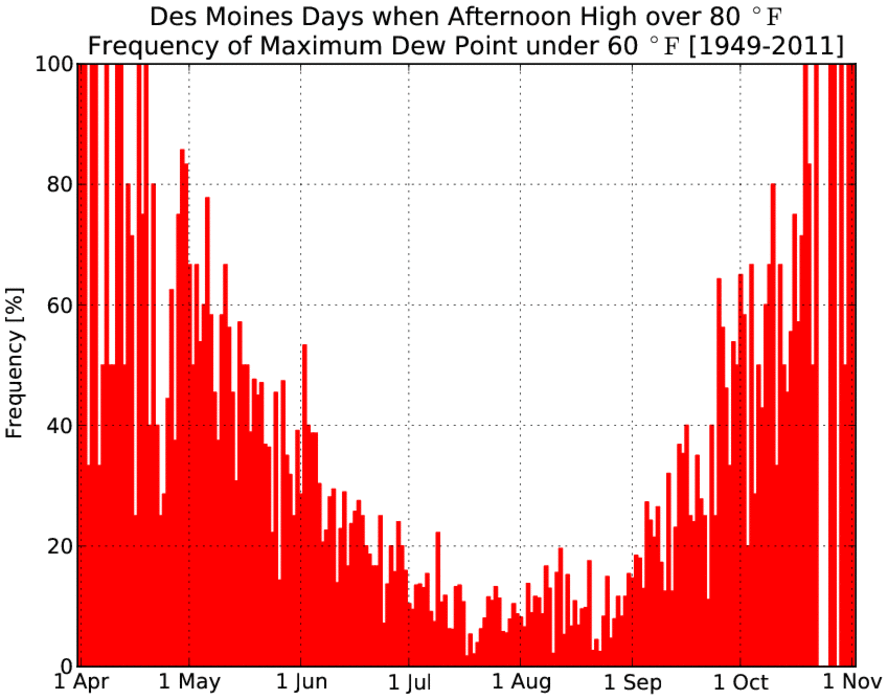
Yesterday was a very pleasant day with highs in the low 80s and
comfortable humidities with dew points in the 50s. The featured chart
presents the frequency of having a dew point temperature below 60 when
the afternoon high temperature was above 80. You can see the frequency
declines as we get deeper into summer and the humid air becomes
unavoidable!
While eastern Iowa was stuck in clouds after morning showers, western
Iowa cleared out and thanks to southerly winds warmed to around 90 as
shown by the featured map of high temperatures for Thursday. Muggy air
has returned for everyone with lows this morning only near 70 and dew
points in the 60s. The warm weather looks to continue with a dry
stretch expected next week.
The featured map is of National Weather Service forecasted apparent
temperature (heat index) for this afternoon showing much of the state
at or above the century mark. It will feel more like mid July than
early June today. A cool down is expected by the end of the week with
highs back in the 70s.
Yesterday was a remarkably warm day with high temperatures in the mid
to upper 90s with some automated stations reporting 100 degrees! It
has been a long time since Iowa has seen this warm of weather. The
featured chart displays the year of the previous date that had
temperatures as warm as those reported by the automated sensors. The
plus symbol means the previous date was during this year. For some
locations, this was the warmest temperature in over 10 years! For the
IEM computed statewide average, yesterday was the warmest day since 1
August 2006 and the warmest day in June since 1988.
Temperatures again soared well into the 90s on Tuesday with a few sites
hitting 100 degrees! It is remarkable to see how long it has been
since we have seen temperatures this warm in Iowa. The featured chart
displays yearly maximum temperatures for Mason City and yesterday's
high of 99 is the warmest since 1995! If one considers that this is
only June, one has to go back to 1988 for the previous warmer
temperature. It is probably not a good thing when our current weather
starts comparing with 1988, which was a drought year in the state.
Visible satellite imagery from Wednesday afternoon shows the eruption
of storms over eastcentral Iowa. It also shows smoke plumes from the
wild fires over the southwestern US (the fuzzy striations). These
storms formed along a front that ushered in much drier and cooler air.
Large hail and strong winds were reported from some of these storms.
Early Thursday morning, the Wichita Kansas airport weather sensor
recorded a somewhat rare meteorological phenomena known as a heat
burst. These events consist of a rapid rise in temperature along with a
drop in dew point. The featured chart displays the one minute interval
observations from the airport sensor showing perhaps two heat burst
signatures. A rise in temperature to over 100 degrees can be seen along
with a drop in dew point to near 30. The physical reason for these
events remains somewhat a mystery, but they are almost always found
near an area of rapidly decaying rain showers.
After one of the warmest stretches in early June on record, high
temperatures have been struggling at near record minimums as shown by
the featured chart of daily percentile values for high and low
temperature. Average highs are in the low 80s for this time of year and
we should get back to those levels by this coming weekend.
A small storm complex make its way over Iowa on Monday dumping heavy
rain and producing a fair amount of wind damage in its wake. This wind
damage was from a strong "wake low" structure that can be seem by
observing rapid pressure falls behind an area of precipitation. The
featured chart is from the Colo KCCI SchoolNet station showing a rapid
pressure drop along with increasing winds to over 65 mph. If you look
carefully, you can see the absolute peak in wind speed (68 mph)
occurred as the pressure reached its lowest value.
The featured map presents the number of tornado warnings issued by each
NWS forecast office so far this year. The largest value is 179 by the
Memphis office. This year has seen more than its fair share of
tornadoes. The largest numbers of warnings are shifted a bit east of
the traditionally known tornado alley. Iowa has seen its share of
severe weather recently, but most of it has been hail and wind.
On a statewide average basis, precipitation since 1 April is an inch or
so above average and comfortably behind accumulated totals from 2008
and 2010. Our recent stretch of wet weather has turned the slope of
this year's line to resemble that of our recent big flood years. This
plot does not tell the story of the record flooding along the Missouri
River due to upstream rainfall and snow melt. The forecast has more
rain chances with a return to summer like humidity and temperatures.
On 17 June 2001, the initial dedicated IEM web presence was brought
online making this the 10th birthday for the IEM! The featured chart
presents the running maximum daily number of hits made against the
website. The past ten years have been quite the experience as the
website has built up massive archives of data and exposed this data via
various web services. The most rewarding part of the IEM has been the
close interactions with those in the private sector and other
government agencies that have made the IEM possible. The work will
continue as there are still more datasets to pull in and improvements
to be made to the entire system.
The Storm Prediction Center has a moderate risk of severe weather
forecasted for portions of Iowa today. This is thanks to a spring like
storm system that will move out into the plains today. The passage of
this system will usher back in cold air for this time of year with
highs only in the 60s later this week!
Most parts of Texas have seen a remarkably hot June with record daily
high temperatures set seemingly each day. The featured chart is of the
past seven days for Childress, Texas showing temperatures above 100
degrees each day. Iowa has not seen weather like that for many years
and from the looks of the forecast, it will continue to be that way.
Highs tomorrow and Thursday look to be in the 60s.
For Ames, yesterday's rain put the total for June above average. The
featured chart presents the June and yearly rainfall totals. The year
long total has been above long term average each of the past nine
years, but the June total has not been as consistent. More rain is in
the forecast to add to our June totals.
High temperatures on Wednesday struggled in the 60s and were only a few
degrees warmer than the coldest high temperatures on record for the
date. This was thanks to a thick cloud cover and cold air brought in
from our north. The featured chart looks at a measure of the amount of
cloud cover on days were the high temperature was at record minimums
and maximums. It makes intuitive sense that the coldest days are
typically more cloudy during the spring, summer, and fall months as the
sun is effective at warming the ground thanks to its high declination.
Clouds are less important in the winter months as temperatures are
dominated by organized air masses and the sun is less effective. For
the warmest temperatures, having more sunny conditions are the most
important in October it appears. Outside of a blip for warmest days in
May, the plot has two clear annual signals!
This June has seen its fair share of extreme high temperature both on
the warm and cold side. The featured chart compares the number of days
above the 75th percentile with the number below the 25th for each June
back to 1893. An average year would see around 15 days per month
within these two intervals. Interestingly, it is much more rare to see
many days in a month below the 25th. This is because the cold patterns
tend to be more transient than the hot and dry patterns that can be
reinforced by ample sunshine and dry conditions.
Two bow echos raced over Iowa Sunday evening with the second storm
system being quite strong. The featured map displays NWS issued local
storm reports of strong winds. Gusts over 70 mph were reported at a
number of locations. The weather today should be calmer with warmer
temperatures expected later in the week.
The featured chart presents the frequency of a given day being one of
the seven warmest for the year. July is clearly the winner with most
days having an one in ten chance of being one of the seven warmest for
the year. The red bars indicate the warmest seven days so far this
year and given that these days fall outside of the higher
probabilities, perhaps we can expect warm days ahead in July with highs
well into the 90s? The forecast has highs above 90 on Thursday and
Friday.
Yesterday saw no rainfall in the state and made for only the fifth
completely dry day this month based on IEM estimates shown in the
featured chart. Mostly dry weather is expected to continue this week
with very muggy air set to return along with high temperatures in the
90s. Summer will be back in full force!
The past few days have seen a respite from the summer like dew points
near 70, but that will change today with very warm and humid air set to
arrive with high temperatures well into the 90s. The featured chart
presents the dew point values reported by the Ames Airport sensor since
the first of the month. We have not had many extended periods above 70
degrees and a number of days below 60. The field crops have yet to get
to their intensive transpiration periods yet, which is a big source of
humidity in the summertime in Iowa.