The featured chart presents the monthly average temperature departures from present day
climatology for Ames. April was the seventh month in a row below average for Ames.
Based on preliminary data, the past six months have seen temperatures at least 2 degrees
colder than average making for the longest such streak for Ames on record. Previous
longest was five months in 1947. The El-Nino 3.4 index value is overlain on the plot for
comparison.
This April continued the recent trend of having Aprils with above average precipitation.
The featured chart shows the monthly precipitation departures for the past 22 years for
Ames. Each colored cell represents a past month and year. The highlighted cells illustrate
our recent history being having a wet April and a dry summer. The forecast for the first
week of May looks mostly dry with better chances of rain arriving next week. At least it is
not snowing like it was this time last year!
Temperatures for the recent past have been a struggle with our last day in the 80s back on
Easter Sunday. This looks to change this week with 80s forecasted to return to Iowa. The
featured map presents the average first date of 80+ degree temperatures for the year and
those locations have have hit 80+ degrees so far. As with previous plots like this for 2014,
the eastern portion of the Midwest has been the furthest behind. The impact of being next
to the Great Lakes can clearly been seen as it takes those areas the longest with all the
cold water nearby.
The past few days of sunshine and warmer temperatures have helped warm soil
temperatures back above the critical 50 degree level. The featured chart presents a time
series of four inch depth soil temperatures for each of the past 26 years with a simple
average plotted in black. 50 degrees in an important threshold for crop growth and you
can see that the further we get into May, the much less likely it is to breach this level to the
downside. Wet soils are the current limiting factor for crop planting progress this spring
and rainfall is in the forecast with the best chance on Thursday.
Hitting 90 degrees for the first time this year appears possible for parts of Iowa on
Wednesday. The featured map presents the average first date of 90+ degrees with those
locations already over 90 this year denoted by an x. Iowa is shown ranging from mid May
over western Iowa to early June over eastern Iowa. So hitting 90 today would be a bit early,
but we will certainly take it after a long and cold winter season. Note that years whereby 90
degrees was not hit were not included in the analysis.
Des Moines hit 90 degrees for the first time this year on Tuesday. This was about four
weeks earlier than long term average. The featured chart presents the average first date
of the year for a given high temperature and the dates for just 2014. For some
temperature thresholds, this year was earlier than average and for others later.
Temperatures on Thursday will be cooler with chances of thunderstorms, some of them
being severe.
Drought conditions are very difficult to quantify as intense short term precipitation events
can seem excessive, but not make up for long term deficits. The featured chart shows the
30, 90, and 365 day trailing departures of statewide averaged precipitation. The recent
past has seen short term excesses while the long term has gone negative, how could that
be? Last spring was the wettest spring on record for the state, so this spring has not been
as wet. For the 365 day average, the extremely wet period from 2013 is being replaced by
less wet conditions this year. As the window marches forward, this trend will likely continue.
Thankfully, the high end tornado threat did not materialize in Iowa on Mother's Day, but
there were still a number of storms producing brief tornadoes. The featured map presents
the year of the last tornado warning issued by the NWS for a given county. Please note
that current warnings are "storm based" and issued for a polygon area, but they are still
associated with counties. The map shows Allamakee County with the longest warning
drought in the state. Severe weather is possible again today with the highest threat over
eastern Iowa.
The recent numerous rounds of thunderstorms has relented and the precipitation totals for
May have been impressive in some locations in the state. The featured map presents
estimates by the NOAA MRMS project showing the highest totals over southern and
western Iowa. As with the heavy rains of April, some parts of the state have missed out.
Those include southeastern and northwestern Iowa. The near term forecast has cold
conditions and only light amounts of precipitation.
The cool weather is back with high temperatures on Tuesday struggling in the 50s. Growing
Degree Days are a long used metric with direct applications to plant development. The
featured chart presents the 15 April to 13 May GDDs accumulations for each year since
1970. Four of the past five years have seen much below average accumulations This
computation was done with a base temperature of 50 degrees Fahrenheit which means
when the temperature is barely above this level, few units are accumulated.
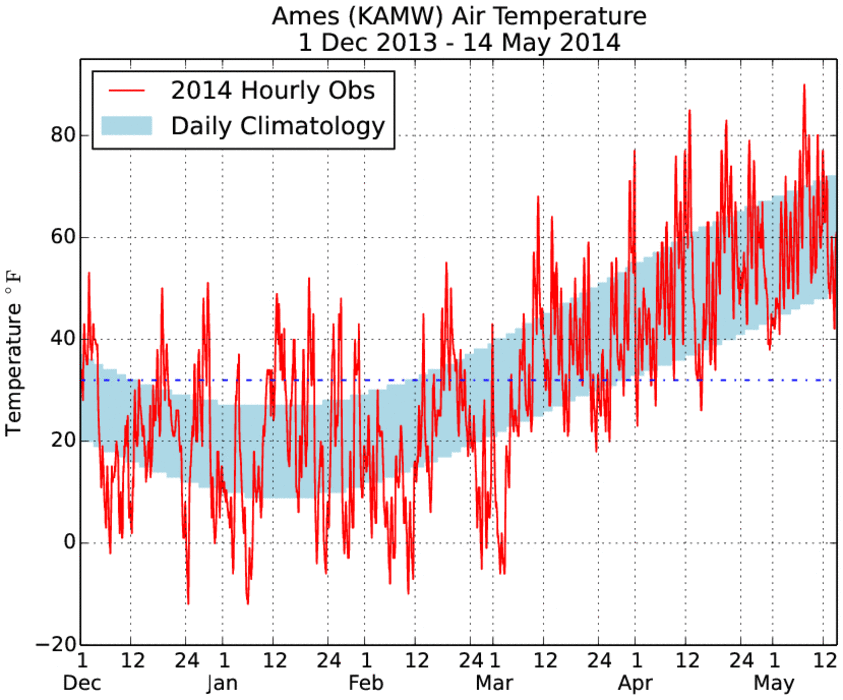
The featured chart presents a time series of air temperature from the Ames Airport weather
station since the first of December. The shaded bars indicate the daily high and low
temperature climatology range. The recent few days have seen cold temperatures, but
have stayed well above freezing for the Ames area. The last freezing temperatures were in
mid April. The chart also shows our most recent winter season and while there were very
cold periods, there were also warm periods. These swings were thanks to limited snow
cover, which allows temperatures more freedom on the warm side. Temperatures are
expected to warm this weekend and be back in the 70s for highs next week.
Thursday was a very cold day in Iowa for May with highs struggling to reach 50 degrees
and some locations reporting frozen precipitation. The featured chart looks at the hourly
temperature reports from the Des Moines Airport versus long term hourly climatology for
the middle of May. The bottom chart shows the hourly temperature percentiles with lower
numbers indicating more extreme cold. Needless to say, we should be at much warmer
levels than those on Thursday. Friday is starting off very cold as well with frost expected
over much of the state this morning.
After an ugly stretch of cold weather last week, this weekend was delightful with sunshine
and pleasant high temperatures. It was even warmer in Waterloo than Anchorage Alaska
again on Sunday! The featured chart compares the daily high temperatures this year
between the sites. The red bars indicate days that were warmer in Ames and the blue bars
are for Anchorage. The black line represents the daily difference in high temperature
climatology (it should be warmer for Waterloo on average). The totals for warmest days
this year shows Anchorage winning! Before you decide to move there for warmer weather,
much warmer air will be here for this week with highs near 80 and highs for Anchorage near
60!
Late last week and into the weekend experienced some very cold temperatures for mid May
with the featured map display reports of sub freezing temperatures. The red crosses are
reports below 29 degrees Fahrenheit and the blue squares are reports between 29 and 32
degrees. Temperatures can vary dramatically even with modest terrain differences, so
many low laying areas in Iowa probably had frost on them at some point. Warmer weather
this week and warm over night temperatures will help warm the soils back up and help crop
development.
The HRRR model is a recently developed weather prediction system run by NOAA that
forecasts weather out for 15 hours and run 24 times per day (each hour). For any given
time, there are 15 previous forecasts made for that time. On Tuesday, successive HRRR
runs were predicting storm development in western Iowa just northeast of Council Bluffs.
The featured map displays the frequency of where the forecasted storm development
would be at 4 PM. The higher percentages imply more insistence that the model believed
storm development would occur at that location. The inset image shows the actual RADAR
presentation at 4 PM and sure enough, the HRRR was mostly correct with the initial
development! Please note that a smoother was applied to the data to aid in this
comparison.
Last fall, the IEM gave a presentation on the tedium involved with answering the question
of how much did it rain in Ames? With life imitating art, the storm on Tuesday evening
produced an amazing rainfall gradient over Ames with CoCoRaHS reports in nothern Ames
below two inches and the Airport reporting 3.03! A bunch of hail fell with the storms as
well. The airport sensor reported 1.6 inches in just 20 minutes!
The rainfall on Tuesday evening for Ames came very quickly as shown by the featured
chart of one minute interval precipitation from the airport weather sensor. The chart
displays extrapolated rainfall rates based on the one minute data over different periods.
Thankfully, the most intense rainfall rates only last for a few minutes, but they accumulate
quickly. The three inches of rain came in a period of less than 45 minutes! For Iowa and
flat topography, this is about as intense a rainfall as we can get.
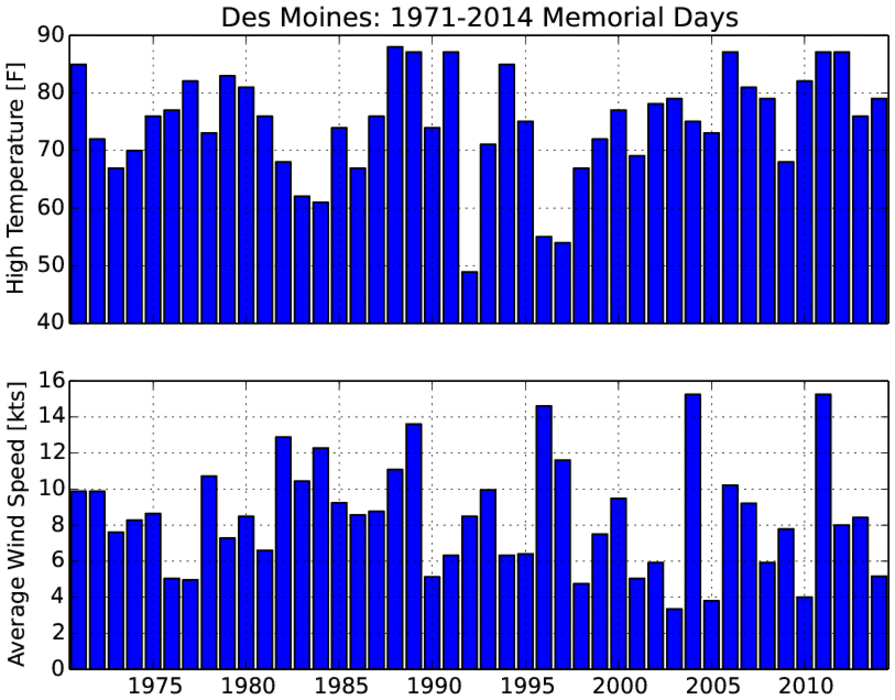
The featured chart presents Memorial Day high temperatures and average wind speeds
for Des Moines since 1971. This year's holiday featured pleasant temperatures and light
winds. There were storms for much of the weekend, but they did not persist long so it was
not a washout. Memorial Day weekend is considered by some as the start of summer and
the forecast this week sure looks like it with highs in the low 80s and lows in the 60s with
chances of isolated storms.
It has felt more like summer recently as the dew point has reached the mid 60s. The
featured chart presents the climatology of mixing ratio, which is a linear measure of the
amount of water in the air, and the levels so far this year. The bottom chart shows the
daily departure from long term climatology. The cold temperatures this year have an
impact on lowering humidity levels as cold air potentially holds less water than warmer air.
We are still a month and a half away from the muggiest time of the year (mid July).
For a brief moment on Wednesday, the air temperature for Mason City was 80 degrees
with a dew point below 50. This makes for rather comfortable conditions. How rare is this
combination of warm temperatures and dry humidities? The featured chart presents the
frequency of such a combination for Mason City and for comparison to a more humid
climate, Mobile Alabama. Please note that these frequencies are for events when the
temperature was 80 or above. Of course, the spring and fall seasons are the more likely
times for this combination as there is much less transpiring vegetation that put a floor on
our dew points in the summertime.
The featured map presents estimated precipitation departure from average for the April +
May period this year. The wettest part of the state for this period has been over central to
northeastern Iowa. The northwestern and southeastern corners have the lowest totals.
The most recent US Drought Monitor resembles this map with the driest depictions in the
aforementioned areas. There are chances of rain in the forecast for the weekend with the
best chances arriving early next week.