After the epic warmth of March, some probably wondered if we would pay
for it with a cold April. We ended up with the first statewide snow-
less April in 122 years! The featured map presents an IEM analysis of
the difference the average temperature during April was from March.
Areas shaded in red had a warmer March than April. Areas around
Chicago and other locations to our east were remarkably warmer in March
by about 3-4 degrees. The start of May looks to bring us warmer
temperatures and numerous chances at thunderstorms along with severe
weather.
Severe weather season kicks into high gear this week for Iowa with
chances just about each day this week. The Storm Prediction Center has
a moderate risk of severe weather for today for portions of western
Iowa. The featured map presents the number of severe thunderstorm and
tornado watches issued so far this year. Portions of western Oklahoma
have had up to 19 watches issued so far, while not all counties in Iowa
have seen a watch yet.
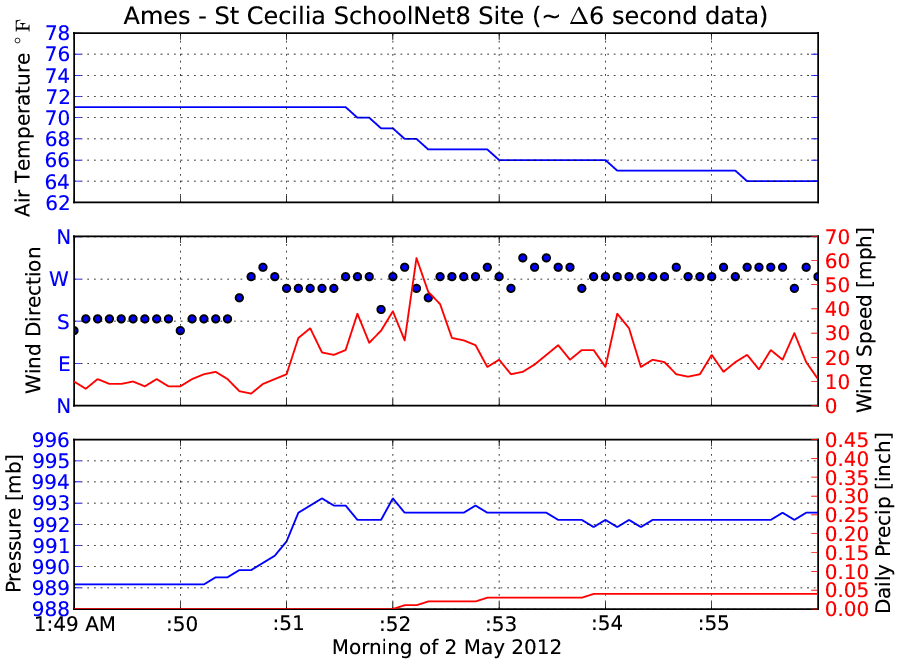
Parts of northern Ames were hit hard early Wednesday morning by a
thunderstorm complex producing straight line winds upwards of 80 mph.
The KCCI SchoolNet8 site in Ames sampled this event at about 6 second
resolution and its data is presented in the featured graph. Data for
only a seven minute period is shown between 1:49 and 1:56 AM. The peak
wind gust of 61 mph occurred very briefly with wind speeds a few
seconds later back down to around 20 mph. The pressure trace shows the
jump in pressure as the colder thunderstorm air rushes by. The wind
direction also shows an organized change from south to westerly winds.
While not definitive proof, this plot would not indicate the presence
of a nearby tornado as there probably would have been a pressure oscillation and more pronounced change in wind direction.
Some locations in Iowa just to the southeast of Des Moines near Pella
experienced a somewhat rare phenomena known as a heat burst. The
signature for these events can easily be identified when high
resolution in time observation data is available. They are marked by a
period of rapid increase in temperature, decrease in dew point, and
typically gusty winds. They are caused by rain showers that rapidly
decay causing very warm and dry air to rush to the ground. The
featured chart presents a time series from the Twin Cedars KCCI-TV
SchoolNet site near Bussey. The period shaded in blue is roughly the
length of the event, just 18 minutes. Other observation stations in
the vicinity recorded this event as well with a wind gust topping out
at 78mph (Pella RWIS) and a temperature rise of 14 degrees Fahrenheit
(Pella SchoolNet). With once per hour observations, these events
typically go unnoticed. Our period of active weather will continue
into the weekend!
Today (Sunday) will end our streak of having the Storm Prediction
Center forecast slight risk of severe weather in Iowa. The featured
image displays the categorical outlook issued each day at 7 AM. We
have one more round of severe weather to go this afternoon and evening
before the weather straightens out some this coming week. It would be
good to see a dry stretch of weather to help get the agricultural crops
planted in the state.
Warm and moist air surged into Iowa this past Saturday pushing dew
point readings over 70 degrees Fahrenheit for Des Moines. The featured
chart presents the period between the first and last 70 degree dew
point each year. Saturday was only the 5th of May making for the
earliest 70 degree reading since 1955!
The featured chart presents the year to date rank and departure this
year's average temperature for Ames compares with previous years. Since
the end of March, we have been in first place and have not relinquished
the spot yet. The forecast for the rest of this week keeps temperatures
near average values and mostly dry.
If you live in Iowa, you may have noticed that the clouds yesterday
afternoon were very thin (having short vertical extent). The featured
chart presents a vertical sounding of the atmosphere over Ames based on
model data from the RAP model. The red line is temperature and green
line is dew point. As the sun heats the ground, the lower part of the
atmosphere warms and mixes vertically until it reaches air that is
relatively much warmer and unwilling to mix down. The sounding shows
that this level was very well defined with a sharp increase in
temperature and rapid decrease in moisture. This caused the vertical
extent of the clouds that developed at the top of the mixed lower
atmosphere to be very flat.
The featured chart presents daily values of precipitable water from the
NAM forecast model provided by BUFR data analysis for Des Moines. This
value represents the depth of liquid water if all the water in a column
of air was converted into a liquid form. In general, higher values
allow showers and thunderstorms to become more efficient rain
producers. The past few days have seen relatively low values of
precipitable water and the result has been dry weather and pretty blue
skies. Values for this variable increase during the summer reaching
totals above two inches.
The featured map is forecast precipitation for this week until Friday
evening by the Hydrometeorological Prediction Center. Only very small
amounts of rain are shown over northeastern Iowa with the rest of the
state remaining dry. A week of dry weather is exactly what most farmers
in the state need to help complete the spring field work.
With the growing season well under way, a useful metric to look at our
progress is called growing degree days. The featured chart presents
the departure from climatology for GDD accumulations over time periods
since the first of the year. Each bar represents the departure from
that date until now. So since the beginning of the month, we are up 50
units and since the beginning of the year, we are up over 300 units.
The right hand axis expresses these departures in terms of average 15
May days. So since the first of April, we are about a week ahead of
schedule.
Temperatures warmed very nicely on Tuesday with Des Moines tieing their
record high for the date of 91 degrees. The heat was accompanied by
rather dry air as dew point temperatures were well below 50 degrees.
The featured chart presents the dew point temperature by day of the
year when an air temperature at or above 90 degrees was observed by the
Des Moines weather sensor. Typically, hot weather in Iowa is
accompanied by muggy conditions with dew point values well above 60
degrees.
May is an active month for severe weather in Iowa. The featured chart
presents the number of county based warnings issued in Iowa by day of
May for each year since 1986. The beginning of May this year certainly
started off active with severe weather each day, but has recently been
very quiet. Humidity values have been on the dry side recently, which
among other factors have prevented storms from developing over the past
week. Thunderstorms are an important part of our climate as they bring
a majority of the yearly rainfall to the state, so we have to take the
good (needed rainfall) with the bad (severe weather).
Our mostly dry stretch of May weather looks to continue into the next
week with only slight chances of showers on Sunday. It has been a
while since we have seen a daily rainfall over half of an inch as shown
by the featured chart. Portions of east-central Iowa have gone over a
month without such a rainfall based on estimated rainfall totals.
While the dry weather has been beneficial to help get the crops
planted, we certainly could use some rain to help the plants get off to
a good start.
The clouds cleared out in time for most Iowans to get a glimpse of the
partial solar eclipse this evening. The featured image is from the
ISUAg Farm webcam showing an internal webcam reflection of the eclipse
of the sun. I was not expecting to get this kind of view, but will
certainly take it!
Precipitation has been difficult to come by for most of May for most in
the state. For Des Moines, 15 straight days have passed without even a
trace of precipitation. This is the longest such streak to occur
within the month of May for the site. According to the NWS, the longest
streak to occur during the spring season is only a few days away at 23
days during March of 1910. This should be our rainy season with
precipitation every three to four days. While the dry weather has
allowed spring planting to mostly finish, some of the seeds are sitting
in dry soil waiting to germinate.
Getting the crops planted each spring in Iowa is not an arbitrary task.
Threats of frost, rain, drought, and soil temperatures are among the
issues farmers need to work through each year. The featured chart
presents USDA weekly estimates of corn acres planted in Iowa since
1979. A few of the extreme years are highlighted in the upper chart.
This year got off to a very early start, but wet weather arrived
causing the planting rate to slow. We recently finished a bit ahead of
schedule thanks to our recent stretch of dry weather. The lower chart
presents the largest weekly jump each year in the percentage of acres
planted. It is interesting to note that this value hasn't increased
over the years. While individual farmers are easily able to plant more
acres in a day, there are many fewer farmers and they need to work more
days to cover the larger farm sizes that currently exist.
One of the reasons for our recent lack of rainfall has been the dearth
of precipitable water. Precipitable water is a measure of depth of
water in a column of air if all phases found were converted to liquid.
The featured chart presents the combination of preciptable water
analyzed by a weather forecast model and the total rainfall for that
day. The upper chart presents the frequency of having rainfall on a
given May day partitioned by preciptable water value. Increasing water
content in the atmosphere increases our chances of rain. The lower
chart presents the combination of daily precip observations against the
precipitable water value. The one to one line shows that often the
preciptable water value provides an upper bound to the amount of
rainfall we may receive. Advection processes help to replenish
atmospheric water content so we can get rainfall totals greater than
the amount of water in the column of air ("in this house we obey the
conservation of mass law").
While rainfall has been somewhat difficult to come by this May in Iowa,
Miami, Florida had a significant heavy rainfall event on Tuesday
totaling 9.70 inches! The featured chart presents the one minute
interval precipitation data for that event. The actual hourly rate
rate peaked at 4.50 inches! This is an intensity that we don't see in
Iowa due to our continental climate. In fact, the 9.7 inch daily total, while only the second largest for Miami in May, is larger than the recorded history records for 95% of the sites in Iowa. Rain chances for Iowa are in the
forecast for this Memorial Day weekend along with very warm
temperatures into the 90s on Sunday.
Mike Bettes and Dr Greg Forbes of the Weather Channel have been roaming
the plains this May on a hunt for tornadoes. The featured plot shows
their driving track for each day they have chased and reported their
location in realtime to the spotternetwork project. Most of the severe
weather this month has been to the west of Iowa with strong storms
again over Nebraska and Kansas this Sunday evening. Some severe
weather is expected over night in Iowa, but it will probably not come
in the tornado variety.
With May now winding to a close, it appears this month will come in
well below average for most of the state. May is an important month to
the yearly contribution of precipitation as shown by the featured
chart. The chart shows the frequency of having a month with the same
direction of departure as the year long total. For example, having
this May be below average precipitation along with having the year of
2012 be below average precipitation. Interestingly, May has the
largest frequencies in both directions. Precipitation in May can help
"set the table" for the rest of the summer, as a wet May leads to
wetter soils and more precipitation chances for the summer. A dry May
can have the opposite effect. Most concerning is that this chart would
indicate a 75% chance of having below average precipitation for 2012.
May is going to end on a cool note with high temperatures in the 60s
for most Iowans and low temperatures into the 40s! This may be the
coolest high and low temperatures for the month. The featured chart
presents the frequency of a day in May having the coolest high or low
temperature. The earlier part of the month is certainly more frequent
than the latter part and it has happened previously that the end of the
month was the coolest.
The last day of May is at hand and while more rain is failing today,
the current difference between May rainfall totals for a location in
far NW Iowa is compared against far SE Iowa in today's featured chart.
Based on preliminary data, Rock Rapids has seen just over four inches
more precipitation than Keokuk so far this May. This would be the
largest difference since the early 1970s. Typically, the largest
rainfall totals are over SE Iowa in May with the smallest over NW Iowa.
So this May has seen a reversal of that, but it is not uncommon.