This March finished without a severe thunderstorm nor tornado warning
issued by the National Weather Service for Iowa. While March is
typically an active month for severe weather in Iowa, there have been
other years since 1986 like this March as shown by the featured chart.
The bottom panel compares the March total number of warnings with the
full year total. There is not much correlation between March and the
rest of the year. We have yet to have an April without severe weather
warnings since 1986. The first week of April looks to be mostly quiet
with temperatures struggling today in the 30s!
March 2012 was one of the relatively warmest months on record for Iowa.
Our most recent March of 2013 was not a repeat performance. The
featured chart displays the daily high and low temperature for March
2012 and 2013 along with the daily climatology for Ames. Places that
the bars overlap are the purple color. Only March 4th of this year had
a warmer high temperature than for 2012. For some days, there is a 30
degree difference from the low temperature in 2012 to the high
temperature this year!
The featured chart compares the average temperature this year over a
given number of days prior to and including April 2 for Ames with the
same period for previous years. The bars indicate the most recent year
with as cold or colder temperature than this year. For example, the
past 10 days this year are the coldest since the same period during
2001. The forecast continues the warming trend we have been on with
60s expected later this week!
Our lack of really warm days and snows in March have not helped soil
temperatures much as shown by the featured chart. The exact opposite
was true in 2012 and the response was to have some of the warmest soil
temperatures recorded since 1988 by mid March. Eventually, climatology
will win this battle and soil temperatures will warm enough to permit
gardens to be planted and agricultural crops to go in. Warmer
temperatures for the rest of this week will help as well.
As featured a few times in recent months, it was very unlikely that the
drought conditions in the state would be busted over the winter season.
There just is not enough precipitation possible to make up long term
deficits during the cold season months. We were fortunately for a
number of heavy snowfall events that have put a small dent into the
drought situation and even eliminated it for parts of the state. April
has started off dry, but that looks to change with rain chances
arriving this weekend and lingering into next week.
The NAM forecast model runs four times per day with each run producing
a forecast out a number of days. The featured chart presents the
summation of the 96 hour precipitation forecast for a model grid cell
near Ames and then the departure from what was reported by the airport
weather sensor. For most of the winter season, the model has
overestimated precipitation. The current forecast has Ames getting
nearly an inch over the next few days.
Wow! Monday was the long awaited taste of Spring with highs in the 60s
and 70s along with sunshine. For many sites in Iowa, it has been a
long while since temperatures were this warm. The featured map shows
the high temperature on Monday and the number of days since as warm a
high temperature. Places like Des Moines had the warmest temperature
since mid November. Some other locations were the warmest since late
October 2012. This taste of Spring was brief as colder weather arrives
today along with chances of snow!
There was no shortage of interesting weather on Tuesday as shown by the
featured map. At 6 PM, a severe thunderstorm watch, an ice storm
warning, a severe thunderstorm warning, and a flood watch were all
active at the same time in Iowa! In fact, one of the severe
thunderstorm warnings was overlapping a winter weather warning. The
map also shows the reported air temperature at that time. The severe
thunderstorm warning over NW Iowa was with an air temperature near
freezing while SE Iowa was near 80 degrees! Over the Midwest, a lot of
hail fell over areas near freezing. The instability to support the
thunderstorms was above a layer of very cold air near the ground. The
active weather continues today with just about everything imaginable
happening at once.
Having hail from spring time thunderstorms is not an exceptional event.
Having hail while near surface air temperatures are near freezing is
exceptional. The featured chart compares recently reported hail size
and an approximate surface air temperature from a nearby reporting
station. It is remarkable to see so many hail reports at temperatures
even below freezing. The thunderstorms were feeding off of instability
based well above the surface. Having a cold layer of air near the
surface also helped hail stones to reach the ground without mostly
melting on the way down.
While we are in the second week of April and Spring started a number of
weeks ago, our actual weather has been a different story. Northwest
Iowa picked up the heaviest snowfall totals in the state from our
recent storm. Totals were much higher to our north and west along with
significant amounts of freezing rain causing major problems. Is this
our last snow maker of the season? Some numerical models bring us more
snow next week!
Our recent stretch of rain, hail, freezing rain, sleet, and snow has
been a big help for the drought situation in the state. The featured
chart shows the IEM estimated seven day statewide precipitation total
since 1 Jan 2011. Our recent total just over two inches has been
difficult to come by since mid 2011. More precipitation is in the
forecast with chances just about every day for the next week.
Our recent stretch of wet weather has helped to put a dent in the
drought situation in the state, but the long term deficits remain
rather large. The featured chart shows the 30, 60, and 365 day running
precipitation departures. The 365 day line shows a curious downward
movement even while it has recently rained!? The reason is that the
rainfall we got on Sunday was an half inch less than what we got on the
same day during 2012. It is going to take much more rain to catch up
the long term deficit, but we are about to enter a conflicting period
of wishing for rain and at the same time wishing for dry weather so
that crops can be planted.
Yesterday's feature showed the 30, 90, and 365 trailing departures of
precipitation for Iowa. Today's feature shows every daily departure
to-date since 1 Jan 2011. The Iowa areal average is shown along with
data for Ames and Sioux City. Our above average period currently takes
us back to around the first of September before the deficits quickly
add up. Over which period is the total deficit the most important? It
depends on the application. For example, your lawn may only care about
a couple week deficit as its roots are shallow and it lives on day to
day rains. Trees have much deeper roots and are more sensitive to
longer term droughts as the soil water is depreciated. There is still
hope for more rain this week with thunderstorms likely and then another
chance of snow!
Our weather has been on the cold side of average for much of the past
two months. The featured chart shows the accumulated net number of
days with a high temperature above average for Ames. The comparison
between 2013 and 2012 ends around 17 February as about every day after
that was above average in 2012 and most have been below this year. For
this metric, 2012 was the most extreme year for net number of days
above while 1979 had the most below. 1947 has the closest fit to this
year and is shown as well. The cold weather looks to continue into
next week.
Rainfall was plentiful over much of the state on Wednesday as shown by
the featured map of NOAA NMQ precipitation estimates. These estimates
are primarily based off of RADAR information and show a large swath of
the state in the 3-6 inch total range for Wednesday. So we are rapidly
transitioning from a drought condition to flooding now with more
precipitation on the way along with snow for northern Iowa. Based on
some preliminary IEM estimates, yesterday's statewide averaged
precipitation was 1.93 inches, which would be the highest calendar day
total since 13 September 1961!
Our most recent storm was one for the record books as it appears it
will rank in the top 5 for statewide heaviest rainfall. The featured
map displays the reported daily precipitation for the ASOS/AWOS sites
on Wednesday along with the period since the last event of as large
amount. The heaviest swath fell from the Lamoni to Dubuque area with
Ottumwa reporting nearly 5 inches, which makes for its largest one day
total in 20 years! Monticello came in with just over three inches and
its largest total in just under 10 years.
The snow storms in April for Iowa continued this week with our most
recent bout of winter bringing over 6 inches of snow over extreme
northwestern Iowa. This storm system also brought one of the heaviest
widespread rainfalls in Iowa history for the rest of the state. Is
this finally our last snowfall or could more be on the way?
Unfortunately, more cold weather and snow looks possible next week!
The featured chart presents an IEM computation of the maximum two
calendar day precipitation total for Iowa. The two day total from last
week's storm came in at just over 2.5 inches, ranking it third all-time
behind 1961 and 1946. While this event has produced flooding, it has
also put a huge dent into the drought situation in the state. More
rain and even some snow for northwestern Iowa is in the forecast for
today.
With snow once again visiting the state, our recent stretch of weather
has certainly been on the wet and cold side of average. How did we get
to this point? The featured chart is sometimes called a phase plot and
is often used to explain business cycles. Is this context, the line
traces a time-series of 14 day temperature and precipitation departures
since November 2012. There is a nice property of these plots as they
tend to make loops as physical processes in our atmosphere interact on
timescales longer than one day (think passing series of storm systems
and air mass regime changes). By normalizing the axes to standard
deviation departures from average, the time-series is constrained and
will nicely oscillate around within the plot as temperature and
precipitation departures somewhat correlated. Anyway, you can see the
large jump we have recently taken to over 4.0 SD on precipitation and
-1.5 SD on temperature! From here, we have to loop back to somewhere
at least drier (we are currently at a precipitation extreme) and
hopefully warmer. Thankfully, the forecast is hinting at just that with
warmer weather for this weekend and less rain.
The remarkable April weather continued on Tuesday with our most recent
storm system bringing the heaviest snowfall to northwestern Iowa and
even producing a brief dusting over parts of southern Iowa. Is this
finally the last storm of the season that brings along snow for Iowa?
The forecast does hold some hope that it is. These late April snow
storms are somewhat rare for Iowa, but do occur roughly once every
eight years or so.
April has been on the wet side of average for much of Iowa. For a few
days last week, Waterloo had its highest year to date total on record
as shown by the featured chart. The top panel presents the year to
date precipitation total rank and the bottom panel is the departure
from the previous maximum total. The forecast continues to look mostly
dry with much warmer temperatures, just what farmers currently need to
get the crops planted.
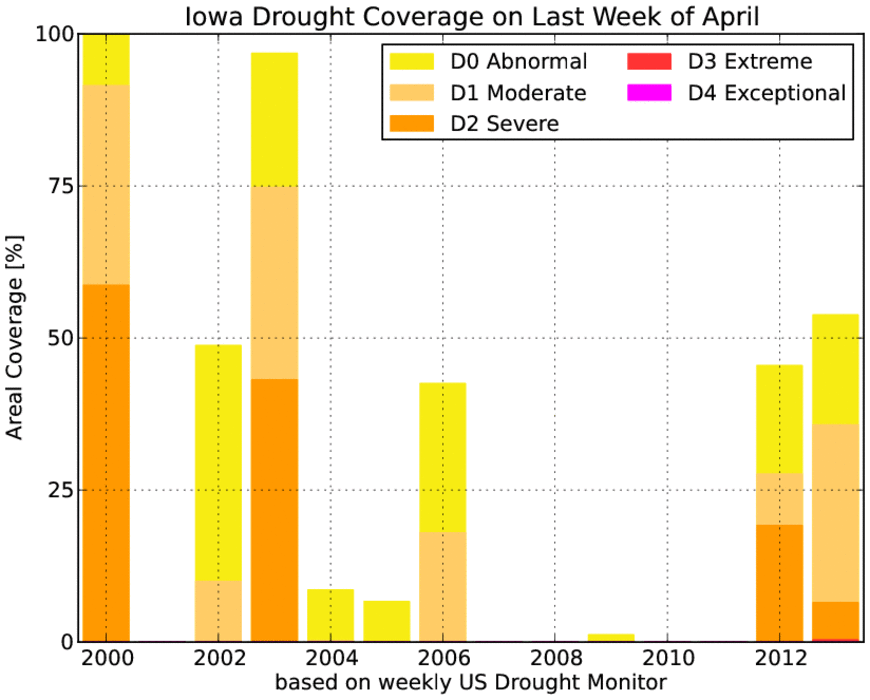
The heavy rains of April have improved the drought situation in the
state considerably, but the featured chart shows that Iowa is still
slightly worse off than last year at this time and in the worst
condition since 2003! The precipitation deficit accumulated from last
year will not be made up for in a month, but will take more wet months
to come. The immediate term forecast looks warm and dry, which will
help the crop planting progress in the state.
Warm air finally arrived for much of the Midwest this past weekend.
The featured map displays an analysis of the difference between the
high temperature on Friday to the warmest temperature reported up until
that date this year. Much of Wisconsin, Minnesota, and North Dakota is
shown in the 15-30 degree range. This represents a rather remarkable
"jump into spring". Unfortunately, much colder air is forecasted to
arrive midweek and highs this coming Friday only in the 40s!
The calendar is about to turn into May, but nearly all of the state's
agricultural ground has yet to be planted. The wet and cold April has
created two problems for farmers. Fields are too wet to transverse
with equipment and the soil is too cold to support growth. The
featured chart presents the weekly USDA corn crop planting progress
report. Only a few years since 1979 have been as slow as this year.
Our recent few days of warm and mostly dry weather has allowed some to
get started, but the weather is about to turn very cold and wet for
early May.