Our recently finished month of March has rewritten the record books in
the Upper Midwest and in some respects, was relatively warmer than the
iconic months during the dust bowl era! The featured chart presents the
monthly record temperatures for Des Moines. The top chart presents the
record temperature along with the year it occurred and the sigma
departure the value was from current day average. The bottom chart
presents the amount the current record is warmer than the second
warmest month on record. The value of 3.5 sigma is shown for March
2012, which is larger than any of the other months. The sigma value
represents how far the observation is away from the mean distribution
of climatology. It provides a simple, but not complete, means to
compare different months of the year. Regardless of that comparison,
the bottom chart shows another exceptional aspect by besting the
previous record by over four degrees! In this regard, this month is
the most exceptionally warmest as well! Amazing to think about what we
just experienced in the context of climatology for Iowa!
While this past March was easily the warmest on record, it was not the
most humid on record as shown by the featured chart. The top chart
presents the average near surface mixing ratio which is the ratio of
water to dry air. By this metric, 2012 comes in a close second place
to 1998. The bottom chart is the simple maximum reported dew point
value for the month. In this case, 2012 ties 1990 at 63 degrees. The
near term forecast has us back closer to reality with highs in the 60s
and upper 50s.
The past few days have seen some remarkable differences in high
temperature over Iowa. The featured chart presents the daily high
temperature correlation coefficient between a handful of sites in the
state. A value of one indicates a positive correlation, but not
necessarily that their daily high temperatures are equal. A short
physical distance comparison is shown for Ames versus Des Moines to
compare against the cross-state pairs. In all cases, the lowest
correlations are during the summertime as high temperatures are often
guided by the effects of clouds and rain from small scale processes.
Looking SW to NE or SE to NW over the state does not appear to yield a
significant difference in this crude comparison.
Our remarkable stretch of warm weather continues to set interesting
records. The featured chart shows the daily high and low temperature
departure from average for Des Moines since the first of March. The
past 26 days have seen a high temperature ten or more degrees above
average. This is easily the longest streak on record for the site and
bests the previous longest streak of 17 days back in Jan-Feb of 1931.
Much cooler overnight low temperatures are set to arrive this evening
with chances of sub freezing temperatures over the northeastern half of
the state.
Sub freezing temperatures have returned to Iowa this Friday morning
after a month long stretch above freezing. The featured map presents an
IEM computed analysis of the number of days since the last freezing
temperature was observed prior to today. The freezing temperatures
this morning may do considerable damage to the some of the temperature
sensitive plants, who got an early start to the growing season. There
are most frost chances in the forecast.
Today's feature is contributed by Chris Karstens. After persistent mild
weather the past few weeks, a cool-down to more seasonable values is in
store this week. The featured chart presents an ensemble forecast of 2
meter above ground surface temperatures for Mason City, with most
models suggesting below-freezing temperatures a good possibility on
both Tuesday and Wednesday morning. A return to above average
temperatures are expected toward the end of the week.
The featured chart is an attempt to illustrate differences in over
night cooling rates by showing a composite profile of temperature for a
three hour period prior to reaching a freezing temperature. The
airport weather sensor in Des Moines is in a very urban area, while the
Waterloo sensor is on the edge of town. The slope of these two lines
is slightly different showing a faster cooling rate for Waterloo. This
is an illustration of the "heat island" effect that is caused by having
lots of heat retaining buildings and pavement nearby the weather
sensor.
With temperatures near freezing, many anxious folks were wondering what the low temperature was on Tuesday for Ames. The answer is: "depends on who you ask!" The featured chart presents observation time-series for various weather stations near or within Ames. The Airport sensor is the official temperature for Ames and was much colder than any of the other sites. The hourly observations are presented on the chart and the site actually reported a low of 23 in-between the hourly reports. Other sites hovered just above freezing. This chart will be updated later today once the minute interval data from the airport sensor becomes available. Also, the NWS COOP site reports once daily and is represented by the short line. Temperatures are colder this morning, so we will have to see how much damage these two days cause the vegetation
Update: Sorry, the one minute interval data from the airport came in mostly missing for this time period.
Cold nights typical of this time of year have taken a toll on the
vegetation in the state these past three days. The featured chart is
of minimum reported temperature from the airport sites since our recent
cold stretch began. Temperatures have dipped well below freezing over
the entire state. Normally, this weather would not be of concern as
our growing season would be starting a few weeks from now. The record
warm winter and March got everything growing much earlier this year and
put our vegetation in a very vulnerable position.
The Storm Prediction Center has a rare high risk of severe weather
forecasted for Saturday with portions of Iowa included in a moderate
risk. This risk is due to the combination of springtime instability
and strongly sheered wind profiles (winds changing direction and/or
speed with increasing height in the atmosphere). This environment
supports classic and long-lived supercell thunderstorms. Besides the
severe weather, Iowa is also expected to pick up some much needed rain
with many locations expected to get much more than an inch of rain.
Storms this past weekend brought damaging winds, hail, heavy rainfall
and even tornadoes to Iowa. The weather sensor at the Des Moines
Airport reported its second largest daily rainfall for the month of
April. The featured chart presents the one minute interval rainfall
observations from the site. These values are extrapolated to rates
over an hour period showing peak intensities over 12 inches per hour!
Of course, these most intense rates do not last that long with actual
hour accumulations reaching just over 2 inches per hour (red line).
The past two days have seen quite a bit of wind with high wind warnings
and wind advisories issued by the National Weather Service. The
featured map presents a crude calculation of the amount of air that
passed by an observation station as expressed in miles of wind. As in
your car, the distance traveled is simply the product of your speed and
the time you traveled at that speed. This calculation is shown in the
featured map with some locations over 1,000 miles in the past two days.
More gusty winds are expected today.
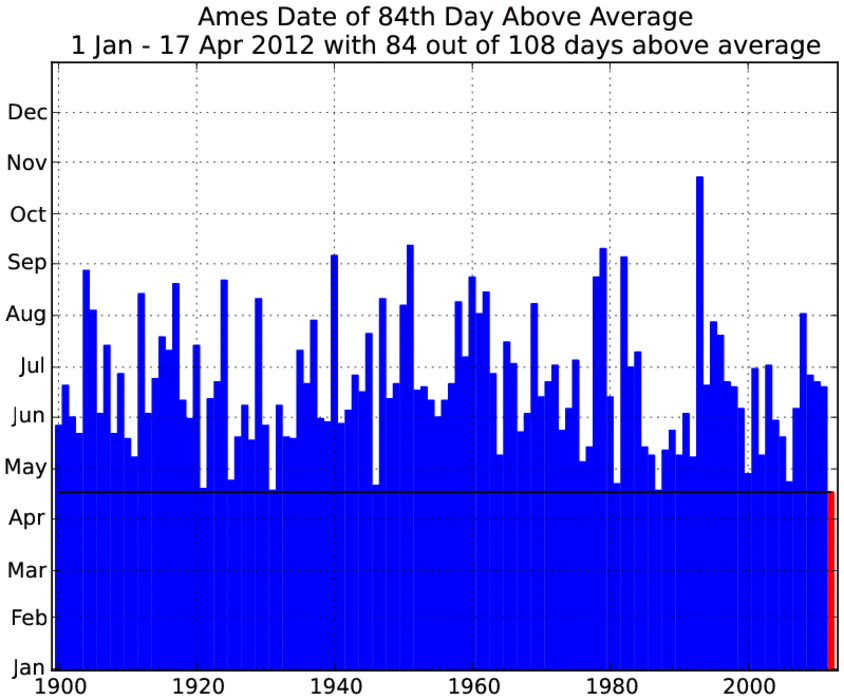
Yesterday was yet another day this year with the high temperature above
average for the date, which made for the 84th day this year above
average. The featured chart presents the day which was the 84th day
above average for each year since 1900. For 1993, it took until the
October to have this many above average days! For the past five years,
this total was not reached until June! Just another way that this year
has been exceptional.
Now that we are in a stormy springtime pattern, most people know that
night time is best time for thunder storms in Iowa. Of course, this is
also the time when most of us are trying to sleep! The featured chart
presents the climatology of thunderstorm reports from the Des Moines
Airport partitioned by hour of the day and week of the year. The
highest frequencies are clearly during the night time hours in the
spring and summer seasons. Prior to about mid April, there does not
appear to be much of a night time signal with all hours of the day
having about the same frequencies.
Your Thursday's weather experience in Iowa depended greatly on your
location as a warm front bisected the state with lots of rain and cold
conditions over the north and warmer conditions to the south. The
featured chart compares air temperatures for five locations in Iowa on
Thursday. For Mason City and Algona, temperatures did not warm at all
during the daytime. The warm front lifted just far enough north to
help Ames reach the 60s, but them quickly retreated back south. High
temperatures today will be in the 50s with warmer weather expected next
week.
The featured chart compares the average Ames temperature for March with
the following April for each year since 1893. For Ames, each April has
been warmer than its preceding March. After our record setting March
this year, there may have been some doubt if April would be warmer as
well. The forecast has temperatures warming back up this week, but
cooler weather expected again next weekend.
Back in March, our soil temperatures were well above average thanks to
our record warm conditions. Since then, we have cooled around ten
degrees and are hovering at the critical value of 50 degrees needed for
corn crop development. While the next few days will be warm, another
cool period is expected into the weekend with highs back in the lower
50s and low temperatures in the 30s and 40s. The warm weather in March
will be mostly for naught as our growing season gets off to a slow
start.
Temperatures warmed quite nicely on Tuesday and to record levels for
places like Sioux City. The featured map presents high temperatures
for Tuesday showing that not everyone enjoyed having temperatures into
the 80s. Forecasted highs today are expected to be slightly warmer
with a chance of severe weather over eastern Iowa.
An interesting phenomena called a heat burst appeared to happen to
folks just to our south in Springfield, Missouri. The featured chart
presents the one minute interval observations from the airport sensor
showing the typical rise in temperature and increase in wind speeds
associated with these events. They are caused by rapidly descending
air often from decaying thunderstorms that warms thanks to the ideal
gas law. Some of the more extreme events have caused plant damage and
other damage related to high winds.
The featured map is forecasted probabilities for an inch or more of
snow on Saturday from the Hydrometeorological Prediction Center. While
most of Iowa looks to avoid the best chances of seeing snow, the
temperatures will certainly be plenty cold for this time of year with
high temperatures this weekend struggling in the lower 50s. The good
news is that warmer weather is expected next week, but chances of rain
will be with us for most days.
High temperatures struggled this past weekend in Iowa thanks to cloudy
and rainy conditions. The featured map presents a simple analysis of
the difference between the high and low temperature on Sunday. Only
portions of extreme eastern Iowa saw high temperatures much above their
low. Having a difference of less than five degrees is rare for this
time of year happening a return period of once every 75 years or so.
Warmer weather is set to arrive this week along with plenty of chances
of rain.