The featured chart presents the yearly number of SPC issued watches
before and after 1 April. This year has seen about twice as many
watches to this date than last year, but only half the total of 2008
and one of the smaller totals since 1997. The largest total of watches
on this chart (2003) started off with a near average total prior to 1
April. Chances of severe weather arrive in Iowa on Sunday and
hopefully some warmer weather as well.
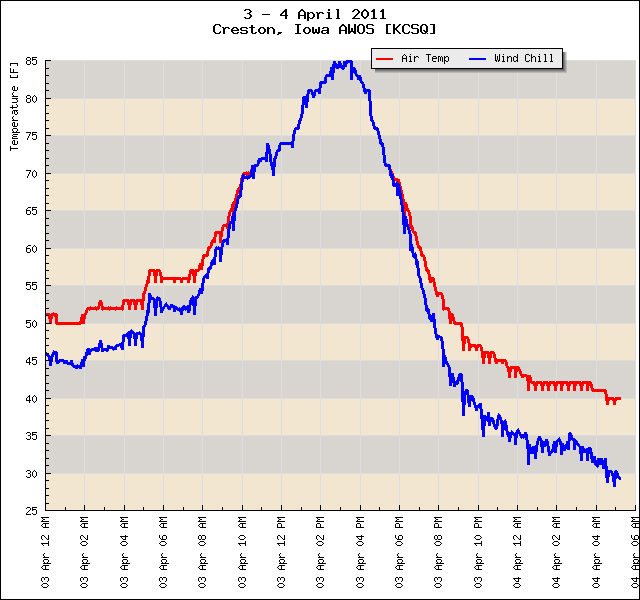
Temperatures have been cut in half from highs on Sunday in the 80s for
many in Iowa to current temperatures in the lower 40s this Monday
morning. This strong temperature gradient is helping to drive a strong
line of thunderstorms south today with more severe weather expected
over the deep south. Our temperatures are expected to recover tomorrow
with highs back in ths 60s.
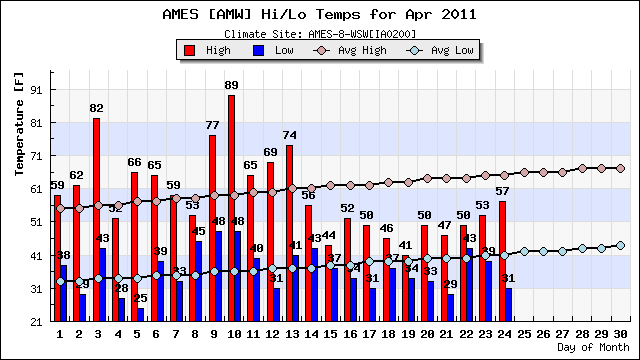
The high temperature on Monday was 30 degrees colder than the high on
Sunday of 82. The featured image presents the extreme day to day high
temperature changes based on data for Ames. A 30 degree negative
change is near the maximum experienced for early April. The chart
nicely shows the annual cycle with a minimum in temperature swings
during the summer.
The featured chart presents the difference between the afternoon high
temperature and the morning low temperature for Ames since the first of
the year. On Tuesday, temperatures warmed 40 degrees and made for the
second time this year for such a strong warm up. Low temperatures this
morning are starting off much warmer than yesterday, so temperatures
will not have to warm as much to get us back into the 60s today.
The most recent outbreak of severe weather over the eastern US was one
of the larger ones on record. The featured map presents the time
composite maximum base reflectivity of NEXRAD along with the tornado
and severe thunderstorm warnings issued. The deep south is nearly
completely covered with both. The main severe weather mode was
damaging winds and a number of tornadoes were reported as well. There
are 733 warnings shown on this map!
While the federal government is expected to shutdown today, our active
weather is just getting started. The Storm Prediction Center has a
somewhat rare moderate risk of severe weather already forecasted three
days out for Sunday. The featured image shows a model's forecast of
dew point for Sunday afternoon. The strong gradient of dew point is
indicative of a dry line feature that is expected to make it into the
state. These boundaries can help focus severe storm development and
give them low level wind sheer to become more severe. The other thing
to note in the plot is the summer like dew points in the warm sector of
the storm well into the upper 60s. Severe weather is possible in our
area for the next three days.
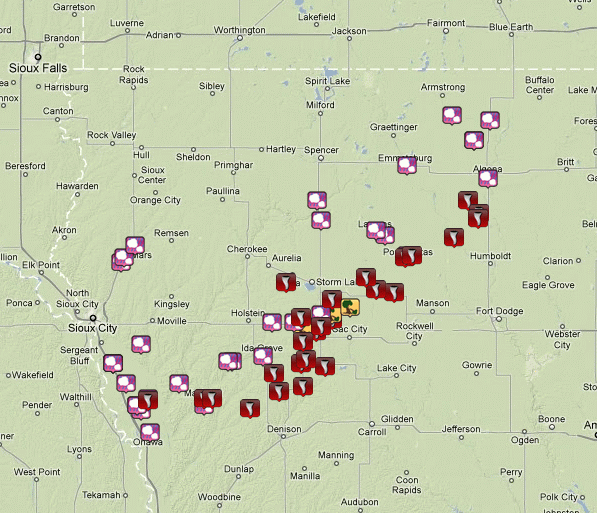
A handful of powerful supercell storms lifted northeast along the warm
front Saturday evening putting down a number of tornadoes. The
featured map is a summary of the local storm reports with most of those
tornado reports coming from one supercell that developed north of Omaha
and survived all the way to northcentral Iowa. This situation was
particularly dangerous as many of the tornadoes occured after sunset.
The town of Mapleton was particularly hard hit with reports this
morning of over half of the town heavily damaged.
Thanks for a strong low pressure center to our north pulling warm and
humid air into the state on Sunday, temperatures climbed well into the
80s and even topped out at 90 in Des Moines. The featured chart
presents the first day of each year that the temperature hit 90 or
above. This year tied for second earliest behind 1986. The average
first day is not until the first week of June! The bar colors
represent if the year was earlier (red) or later (blue) than average.
Temperatures today will struggle to reach 60 with cooler weather
expected for the rest of the week.
The featured map presents rainfall estimates for April. Some portions
of the state have missed out on the rainfall events this month, while
most others have not seen extreme totals to this point. Our next
chance of rain and even snow arrives later this week with the heaviest
totals expected over eastern Iowa.
After warming to near 90 degrees this past weekend, chances of snow are
in the forecast for Friday. The featured chart presents the maximum
temperature for the week leading up to the final snowfall of the
winter/spring season. The size of the dots represent the snowfall
amount with the largest value of 11 inches on the map and the minimum
was at least an one inch requirement for the chart. Having warm
temperatures and then a snowfall is certainly not uncommon, but if it
were to happen Friday and be the final snowfall of the season, it would
be the warmest temperature before a final snowfall!
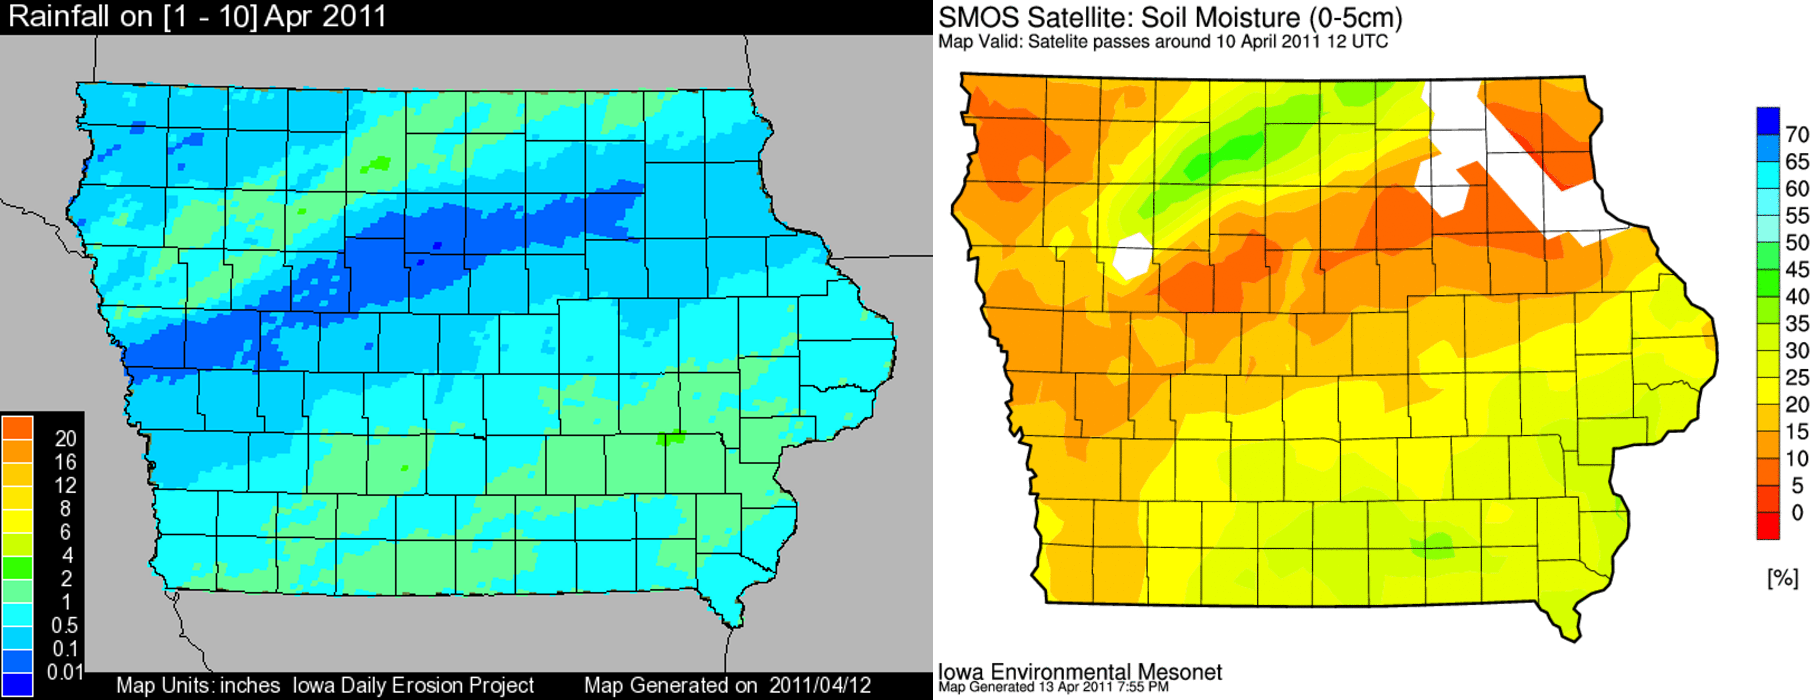
A few days ago, the total rainfall for April was featured showing a
swath over the state that has missed out on the heavier rains (first
image). A group here at ISU is working with a satellite called SMOS
that attempts to sense the moisture in the upper few inches of soil.
The SMOS soil moisture percentage is presented in the second image.
The patterns line up very nicely where the areas that have received
rains have wetter top soils than other areas. You may think this to be
obvious, but having two independent datasets agree with each another is
an encouraging sign and hope that the satellite is providing quality
information. This plot has implications for spring farm field work as
the upper top soil needs to be somewhat dry to support heavy equipment
transversing it. Look for more SMOS information to appear on the IEM
soon!
Today has the chance to be the coldest high temperature so far for the
month of April for Ames. The featured chart presents the frequency of
a day in April having the coldest or warmest high temperature for the
April of each year. So having today have the coldest high for the month
has happened twice in the past. The chart indicates that the coldest
high is typically during the first 6 days of the month. Of course, our
increasing daily climatology helps guide this chart and you can see the
most number of warmest highs occurs on the last day of the month.
Decorah, Iowa now famous "Eagle Cam" shows the result of hopefully our
last bout with winter, snow! Light snow fell yesterday over portions
of northwest Iowa and now today over northeast Iowa. The snow does not
have much chance of sticking around this time of year, but the cool
weather is forecasted to continue through the end of next week.
This past weekend saw yet another severe weather outbreak with numerous
tornadoes reported over the deep south. The featured map (click for a
better view) shows the difference in number of severe and tornado
warnings this year versus last year. Only counties shown in dark blue
have seen a decrease. The deep south certainly stands out with Alabama
having all counties with higher totals than last year. The total count
in this plot is 4,779 warnings for 2010 and 14,517 warnings for 2011.
The total count for 2011 is the largest on record for the period prior
to 18 April.
Our recent stretch of weather has seen high temperatures well below
normal and, as shown by the featured chart, below the 25th percentile.
The forecast does not hold much hope for breaking out of this any time
soon with more rain and highs near 50 expected to continue. This is
not good news for farmers who wish to start planting corn this time of
year.
And yet another explosive round of severe weather visited the United
States last night with numerous reports of large hail, extreme winds,
and tornadoes. These reports were south and east of Iowa as we
suffered through a cold easterly wind and snow over northern Iowa. The
featured chart presents the number of county based severe thunderstorm
and tornado warnings issued by the NWS during April. This year's total
is already nearly double of last April and well above the previous
maximum of 2009.
The featured chart is a wind rose for observations reported so far this
month from the Ames Airport. A wind rose nicely shows the summarized
combination of wind direction and wind speed. The longer the bar is,
the more common the wind has been from that direction. The chart shows
the lack of winds from the SSE around to the west. These winds would
be bringing warmer air into the state and make things feel more like
spring. Our dominant directions have been ENE and NW, which is a cold
and wet combination.
Our recent stretch of cool and cloudy weather has cooled off soil
temperatures to well below normal values for this time of year as
illustrated by the featured chart. Normal temperatures are approaching
50 degrees, which is warm enough to support corn growth. With
temperatures this year well below that value, it will take a few warm
and sunny days to get the ground warmed up again and also dried out to
allow equipment to pass over fields.
Our streak of cool weather for this time of year continues with Ames
having recorded 11 straight days below 60 degrees. Based on IEM
calculations, the longest such streak this late in the year was 14 days
ending on 7 May 1917. The forecast has a chance of tying this record
before warmer air arrives on Thursday.
The featured map presents an IEM calculation of the maximum reported
temperature for a period from 14 to 25 April inclusive. Most of the
Upper Midwest is shown in the mid 60s and lower! This is remarkably
cool for this time of year and has impacted the onset of spring
planting season over the corn belt. We need warmer and sunnier
weather, but the forecast only have brief periods of either.
The nation's recent stretch of severe weather continues with a high
risk of severe weather issued today over portions of Alabama. The
Storm Prediction Center has issued its 228th watch of the year this
morning. Last year, it took until the 27th of May for the 228th watch
of the year to be issued as shown by the featured chart. Three other
years since 1997 have seen more watches issued by this date than this
year.
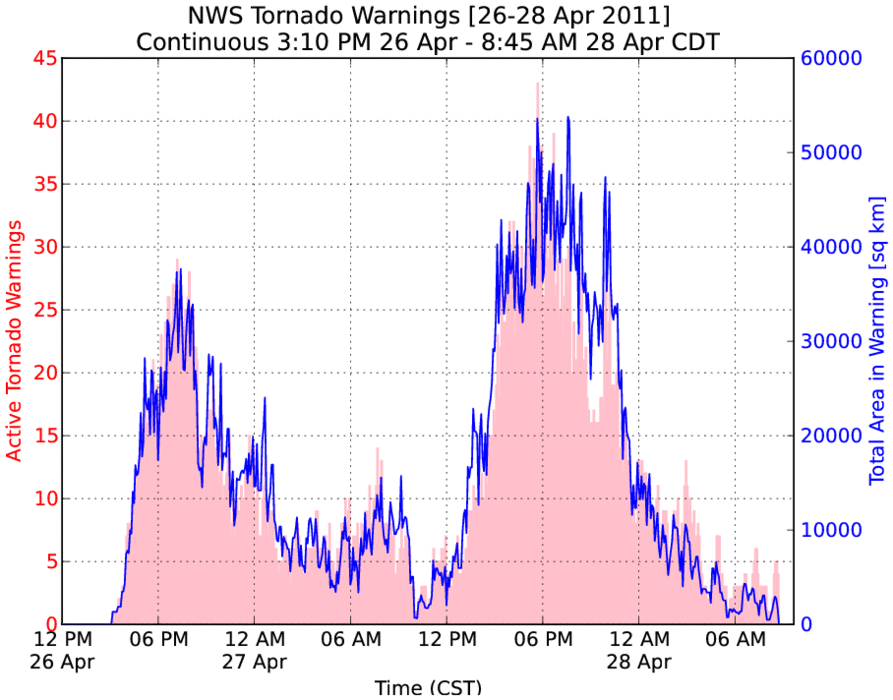
The tornado outbreak of yesterday may go down in the record books as
the largest in US history. The featured chart displays, at five minute
intervals, the total number of active tornado warnings and areal
coverage of these warnings expressed in square kilometers. Since 3 PM
on Tuesday, there has been at least one active tornado warning making
for a streak of 39 straight hours (at the time of this writing). At
its peak yesterday evening, the areal coverage of would have been large
enough to cover roughly one third of Iowa. I'll update this chart once
the streak ends and post the final duration number.
For some locations in Iowa, our recent stretch of sub 60 degree weather
finally came to an end on Thursday. For Ames, this was the longest
such stretch this late in the spring season at 14 days. The featured
chart shows the longest stretches for Ames and then the coldest low and
high temperature afterwards until the end of August. The forecast has
highs mostly in the 60s for the next seven days.