The calendar has flipped into March, so it is a good time to look back on February as is
done by the featured map. Based on unofficial IEM estimates, some eastern locations in
the Upper Midwest just had their coldest February since 1893. Average temperatures were
warmer the further west you travel as the large scale weather pattern in February favored
cold in the eastern US and warm in the western US. Iowa was somewhat stuck in the
middle, but mostly sided with the cold eastern half of the country.
The current winter storm passing through Iowa today is a reminder that there is plenty of
time left for snow producing storms this winter season. The featured chart presents the last
date of the season for one plus inches of snow per year for Des Moines. The horizontal
lines represent the number of days that the snowfall stuck around based on snow depth
reports for days afterwards. The black line represents the accumulated frequency of the
last date. For early March, just over 20% of years have experienced their final inch plus
snowfall.
While the most recent winter storm did not produce much in the way of snowfall as shown
by the featured map, it did also bring some freezing rain which created slick travel for a
while on Tuesday morning. The major storm for the United States today will pass to our
south with Iowa stuck in the very cold air. The forecast does contain hope for spring like
weather come next week, so a spring break may be coming soon for those tired of winter!
Last week, a map was featured showing the average date when the 91 day trailing average
temperature bottomed out for the winter season. If you consider this period the quarter of
the year representing winter, then the date would be the start of spring. The actual trailing
91 day average temperature is plotted for today's feature and it shows that we are currently
on the upswing after bottoming out a few days ago. So we are in spring now! The forecast
has much warmer temperatures starting tomorrow with it continuing into next week.
The featured chart displays a time series of hourly temperatures and daily high/low
temperature climatology for Ames. Since the first of the year, we have warm and cold
periods. For Ames, we have not exceeded 40 degrees since the second half of January.
The forecast has much warmer weather next week with highs even into the 50s!
So far this month, the 5th of March was the coldest for Ames for minimum High and Low
Temperature. The featured chart presents the frequency of which day of March was the
coldest for each year back to 1893. The coldest day does not necessarily always happen
to start off the month. Our current weather and forecast provides some optimism that the
coldest weather of the season is behind us, but there is still plenty of time for more cold and
snow!
Some of the warmest temperatures so far this year were experienced on Monday with the
high temperature approaching 60 degrees for Des Moines. The featured chart looks at the
climatology of warmest temperature to date. Up until recently, we have been under
performing as we had a very cold February. The overall chart mean is shown by the black
line and the changes in slope over the first half of the year are interesting. March and April
are months during which we rapidly warm up as snow struggles to stick around and warm
air masses from our southwest advect in.
Our stretch of warm March weather got even warmer on Tuesday with highs reaching 70
degrees for some parts of the state. Eastern Iowa struggled in the morning to get rid of
some pesky fog, so they missed out on the really warm temperatures. The featured map
displays high temperatures on Tuesday from the automated airport weather stations in the
state. Of course, this is well above average for early March and the pessimist wonders if
this is payback for the cold February or if much colder weather will return again later this
month!
If the current forecast holds, Des Moines would have a streak of seven consecutive days
with a high temperature at or above (AOA) 60 degrees. The featured chart presents the
frequency of such a streak partitioned by week of the year. For the middle of March, such
a streak is a very rare occurrence. Of course, this happens almost every day of during
summer. 60 degrees in March does feel a lot warmer than 60 degrees in July, so most
Iowans are very happy with the current stretch of weather we are in.
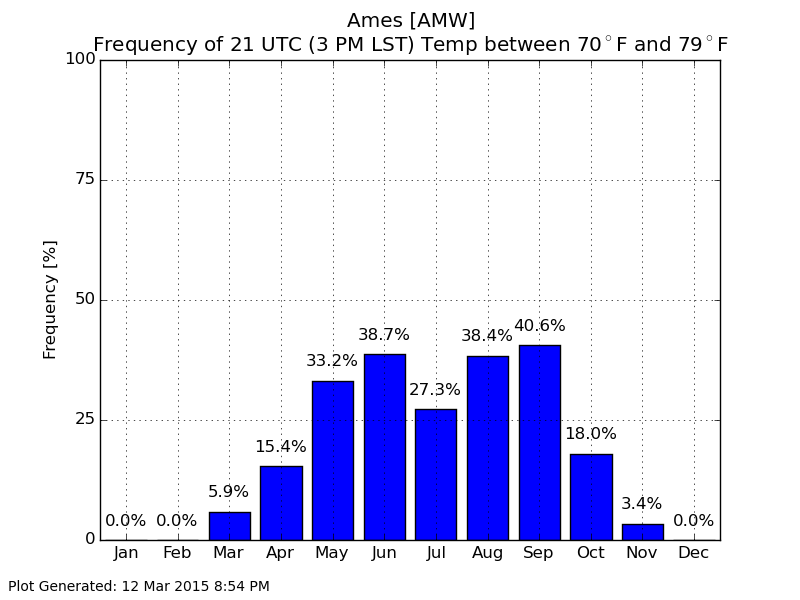
Thursday was yet another very mild March day with the thermometer reaching 70 degrees
for Ames at 4 PM. The featured chart looks at the frequencies of having a temperature in
the 70s at 4 PM (3 PM Local Standard Time) . For March, this only has occurred on 6% of
days, or rewording, about 2 days per month per year in March. The frequencies decline in
the summer as temperatures are often warmer than this particular interval. The mild
weather looks to continue until the end of next week.
The cold start to March is a distant memory thanks to the current stretch of very warm
weather. The featured chart displays the daily high and low temperatures for Ames along
with the daily climatology of both. We are currently working on day 11 of above average
daily high temperatures and today looks to be the warmest day yet!
Temperatures soared on Monday with highs exceeding 80 degrees for much of the state.
Sioux City was able to reach 90! Strong winds were also present with the very warm
temperatures, which as shown by the featured chart is very common when temperatures
get this warm in March. The chart shows the frequency of having a 10+ knot wind speed
present at a given temperature in March. As temperatures increase, the chance that
strong winds are present increases as well. Restating, strong winds are necessary to help
produce very warm conditions in March. On the cold end of temperatures, the opposite is
true. Brisk winds at night time help to keep the lower atmosphere mixed and near surface
air temperatures are not able to cool to very cold levels.
After reaching the 80s on Monday, our highs on Tuesday were much cooler in the 50s.
The featured map displays the maximum negative change in 24 hour temperature. This
metric was computed by subtracting the hourly HRRR model analyses from their respective
analyses from 24 hours previous and then computing the maximum negative change per
model grid cell. Most of the largest differences show up over the high plains with changes
approaching 50 degrees. Our largest changes were in the 30 to 40 degree range.
The featured chart presents the year to date accumulated total of Severe Thunderstorm
and Tornado Warnings issued by United States NWS Offices. Not only is the total for 2015
the lowest since at least 2003, it is not even close to any other year! The next closest year
of 2004 is about four times greater than this year! Of course, a very active severe weather
week could make up these differences, but such a week does not appear to be any time
soon. Eventually the warm and muggy Gulf of Mexico air will surge northward and provide
a needed ingredient for severe weather. This will also provide some needed rain as our
current stretch of weather has been very dry as well.
A very dry March and below average snowfall over the north has prompted the US Drought
Monitor to analyze parts of Iowa in D0 drought designation. The featured chart displays the
areal coverage of drought in Iowa going back to 2000. Drought categories increase up to
D4, which was found in Iowa back in 2012. With no crops in the ground and today being
only the first day of spring, the drought impacts are currently limited to hydrological issues
like stream flow.
Temperatures on Sunday afternoon were quite variable in Iowa with extreme northeastern
Iowa below freezing and southwestern Iowa in the mid 70s! The featured chart displays
temperature reports from the Iowa Airport weather stations since Saturday. The strong
contrast in temperatures is helping to produce heavy snowfall totals that are barely clipping
the northeastern portion of the state.
The most recent snow producing storm dumped an impressive amount of snow over a very
short period of time over a very limited area. The featured map shows an analysis of
COOP, Local Storm, and CoCoRaHS reports. A narrow stretch of northeastern Iowa got 9-
11 inches with totals rapidly dropping off to the south. These types of gradients are
commonly what happens when the snowfall becomes convective . Over Clayton County, the
totals within the county ranged from an inch to eleven inches! This snowfall was extremely
wet and with rain in the forecast, this may cause some flooding issues as it will rapidly melt.
Up until Monday of this week, it has been a long while since rain producing thunderstorms
had visited the state. The featured chart displays the most recent date of reported
thunderstorms from automated weather stations in the state. For some locations like
Dubuque, it has been over six months since the last report! Locations to the north and
west of Dubuque likely experienced thunder Sunday night into Monday with their recent
dump of intense snowfall.
The featured chart displays time series of soil temperature observations from the
Muscatine ISU Soil Moisture site since March 1. The chart is an awesome illustration of how
the frost leaves the ground. Prior to March 7th, the four, twelve, and 24 inch readings were
all below freezing. The frost had not made it to the 50 inch depth. As the soil layers
warmed and reached freezing, it took a bit of time to punch through the freezing point level.
This is due to processes that take extra amounts of heat to convert the frozen water in the
soil to liquid. The four inch punched through first and then twelve and then 24. The chart
shows that this process took eight days to reach 24 inches. Eventually the warming
reached 50 inches and its temperature slowly started to rise as well.
Accumulating snow fell Tuesday night into Wednesday morning with totals approaching four
inches over limited areas of northern Iowa as shown by the featured analysis map. Even
though we officially into spring, climatology tells us that there are still plenty of chances of
snow left before we reach summer. The historical frequencies of snowfall do not reach
negligible levels until the end of April.
Sunday was a very windy day over Iowa with gusts over 40 miles per hour for much of the
state. The featured map presents the average number of days per year that the peak wind
gust for the day was over 40 mph. Local terrain and siting can make a big difference for
this metric as obstructions will slow down the wind. Today will be another windy day with
much warmer temperatures than what we saw this past weekend.
The last day of March is at hand and it would appear to be another dry and warm day. The
featured chart presents Iowa areal averaged precipitation totals for each March since 1893.
Based on preliminary data, this March comes in as one of the driest on record and
continues the recent trend of below average totals. Recent Aprils have made up for dry
Marches and the forecast has some heavy rainfall arriving Wednesday evening.