The featured chart displays the areal coverage of the drought monitor
categories for Iowa since 1 Jan 2012. This winter has seen some small
improvements in the state, but we still have a long ways to go. The
calendar is now March, so our ability to put larger dents in the long
term precipitation deficits are increased. The most recent drought
monitor did not include our large snowstorm on Tuesday, but most of the
precipitation from the event was in the Eastern half of the state. The
most severe drought categories remain over western Iowa.
Our next winter storm system arrived overnight and has dumped a few
inches of snow along with gusty east-southeast winds. Is it common to
have snow being reported along with winds from the ESE? The featured
chart presents a wind rose that summarizes observations from the Des
Moines Airport when falling snow is also reported. The preferred
direction is clearly NW. The least frequent direction is southwest,
which is a wind direction that typically brings us warm weather and
also implies a storm system center that is to our west and north due to
how air flows around low pressure systems.
The first of back to back winter storms dumped just a few inches over
parts of Eastern Iowa on Monday. The second storm system is here this
morning with the heaviest totals again over eastern Iowa. This system
will truck it east and is expected to cause trouble in the Washington
DC area. Western Iowa has missed out again and they certainly have the
greatest need for moisture. After this storm system, warmer weather
will be here with snow melting temperatures near 40.
The second of our back to back snow storms dumped much more snow than
the first. It also brought strong winds which caused blowing snow that
impacted travel. Western Iowa missed out again on the heaviest totals.
Our upcoming weather pattern looks to feel closer to spring than winter
with the next storm system arriving this weekend and looking to produce
mostly rain.
For Des Moines, the high temperature on Wednesday barely breached
freezing. On the same day last year, the high temperature was in the
70s! The featured chart presents the difference in high temperature
each day this year from last. An even larger difference appears on the
31rst where the high was only 15 this year and 61 last year! March
2012 experienced epic warmth, so more very large differences should be
expected.
The featured map presents reported snowfall totals for the winter
season to date from the NWS. Values in Iowa range from around two feet
in western Iowa to four feet for Dubuque. The pattern is not that
simple tho as locations like Mason City and Davenport have missed out
on events in their areas. Will this be it for snowfall this year? A
series of storm systems will affect the area this weekend with rain
changing over to snow on Sunday. It does look to be a mostly rain
event.
Our most recent winter storm system is winding down this morning after
dumping around a foot of snow over northwestern Iowa. The weekend
storm systems also brought much needed rainfall to the state with
rainfall totals near an inch or more in many locations in the state.
This moisture is very welcome and should help the drought situation in
the state. This image will be regenerated later today after more
observations come in.
That strange substance you see moving in area river beds is water! This
past weekend of rain and now melting snow have increased stream flows.
The featured chart presents measured water flow for Squaw Creek in Ames
since mid 2010. Only briefly in early August 2012 was there more water
flowing than now in roughly the past two years. Some locations in the
state are even experiencing flooding!
After yet another snow storm and a day of blowing snow, many are hoping
for spring! Has spring already come? The featured map presents the
date that ends the coldest 91 day (one fourth of the year) period of
the year based on NCDC climatology. If you use this metric to consider
when "spring starts", the general pattern is for spring to arrive first
over the west and progress eastward. Iowa's start date is shown to be
the last week of February which means we are about on week three of
spring already! Perhaps this is why spring seems so short as we go
from winter into summer as snow storms are very common in Iowa for
March, which is a spring month.
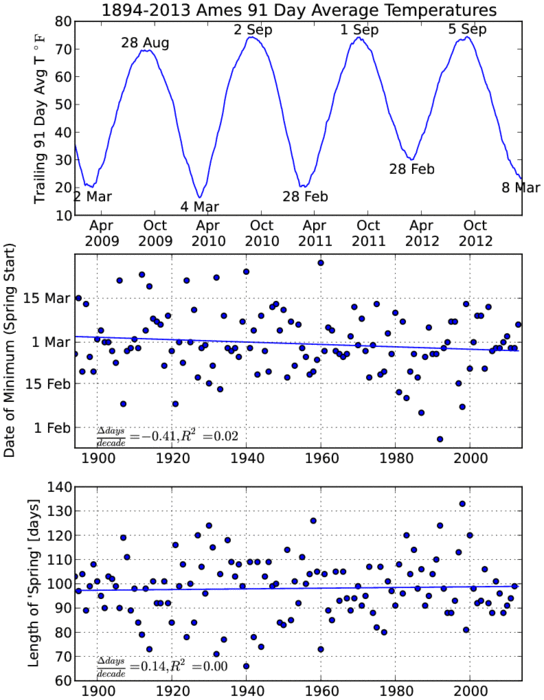
Yesterday's feature presented the end date of the coldest 91 day period
of the year as a proxy for when spring starts. This was based on the
daily climatology. The featured chart today looks at this metric in
more depth. The top panel displays the past four years worth of
trailing 91 day average temperature with the peak and trough labeled.
The middle panel displays the yearly date of this minimum in 91 day
trailing average (denoting the coldest 91 day period for the year).
The bottom panel crudely displays the number of days during the "spring
season, which is the number of days between the trough and peak minus
91 assumed days for the summer. So for this year and this metric,
spring started on the 9th of March. The middle panel shows that this
metric has not made it past the Ides of March since 1960! The bottom
panel would indicate that our recent decade of spring seasons have been
on the short side of long term trend.
Warm air finally returned to the state on Thursday with the high
temperature exceeding 50 degrees in Des Moines for the first time since
13 February. The featured chart displays the streak of days with a
high temperature below 50 degrees and the date on which the streak
ended. The black dots are streaks that happened this winter season and
the red dots are for last winter. April 1 appears to be a boundary
that long term streaks are unable to cross. The reason is that
eventually increasing solar angle and warm air advection from south
will destroy any snowpack that exists in March and help to push
temperatures into the 50s. Another relatively warm day is in store
today before colder weather returns.
Blizzard Warnings are in effect over far northern Iowa for Monday
thanks to a quick moving storm system that will dump snow and then blow
it around a bunch. Are blizzard warnings common as we are mere days
from spring? The featured chart attempts to provide a climatology of
blizzard warnings in the continental US by week of the year. The unit
is the combination of a single NWS weather forecast office issuing a
blizzard warning for a given week of the year. For example, the peak
value in late December represents, on average, seven NWS offices
issuing at least one blizzard warning per year. The chart shows a
remarkable drop during the heart of winter in January. The reason for
this drop is that blizzard systems are driven by large temperature
gradients and amble supplies of moisture, both of which are somewhat
limited in January as most the country is at its coldest.
Even with some sunshine and southeasterly winds, high temperatures on
Sunday struggled to reach 40, which is well below our average for this
time of year. Is it common to have this situation of southeasterly
winds with mostly sunny skies and yet fail to reach climatological
average temperature? The featured chart attempts to answer that
question. The individual frequencies of southeasterly winds or mostly
clear skies leading to well below average temperature is around 20%.
Having both is much less frequent at around one in twenty events.
Today will be another cold day for mid March with a snow storm
producing blizzard warnings in far northern Iowa.
The number of winter storms have come at a frantic pace recently with
our latest bout of winter only dropping a few inches of snow, but also
produced a lot of wind to blow that snow around. The heaviest totals
were in the Dubuque area around three inches. The next big winter
storm looks to mostly miss us to the south! The cold air is going to
stick around in the interim.
2012 has been on the snowier side of average for Des Moines with around
45 total inches reported. This snow has fallen from a total of around
15 snowfall events (assuming back to back days with snow are one event
and not counting trace daily totals). The featured chart displays the
yearly combination of total snowfall and number of events. The year
shown denotes the year of the first half of the winter season. Of the
past 10 years, 5 of them are labelled as on the extremes of this chart.
It does not appear that we are done adding to the totals shown in this
chart with another potential snow storm for Iowa this coming weekend.
Yesterday was the official start of spring with the solar equinox, but
did not feel like it as most of the state failed to rise above the
freezing temperature mark. The featured chart displays the high
temperature for the first day of spring each year for Ames. Only four
other years were as cold as yesterday with the most recent year being
in 1965. The bottom chart shows the year over year change with this
year's change only rivaled by 1911-1912. The cold weather looks to
stick around for the at least the next week with highs struggling in
the 30s.
During March of 2012, it was no problem for our temperatures to reach
the 80s. During March of 2013, getting out of the 30s and 40s has been
a struggle for most of Iowa. The featured chart presents the maximum
temperature each March for Waterloo. The warmest temperature so far
has only been 42 degrees. If this holds, it would easily be the
coldest maximum temperature for Waterloo since 1893. The stacked bars
represent the highest temperature prior to 22 March and then for the
entire month. 1960 and 1962 had a colder temperature to date, but
highs were warmer later in the month. 1962 was even able to reach the
upper 60s after such a cold start. The forecast, at this point, does
not provide hope for a similar event happening this year.
The Des Moines NEXRAD captured a fun phenomena of birds vacating an
area in all directions forming a circle on RADAR. The featured image
is from 11:50 AM this Saturday morning and the center of the circle
appears to indicate the birds were staying at the Hendrickson Marsh
Lake near Collins, IA.
Our latest bout with winter dumped the heaviest snowfall totals in Iowa
over the southeastern portion of the state. Iowa missed out on the
foot plus snowfall accumulations near Saint Louis. The snow is causing
travel headaches this Monday morning as temperatures are cold enough
for roadways to freeze. It will not take long this morning for roads
to start clearing up as even though there are clouds, energy from the
sun is still able to reach the pavement surface and warm it above
freezing.
Our most recent snow storm stopped producing snow for most of the state
on Sunday making for the one of the few snowless Mondays in the past
two months. The featured chart displays the number of hours that the
Des Moines Airport sensor reported falling snow for each day since the
first of the year. Monday and Tuesday have been quite active and this
week should be the first week since late January without snow on both
days. Our next storm system looks to be produce mostly rain, but there
is still plenty of time for another snow storm.
Daily high temperatures have been a struggle in March for Iowa. The
featured map displays the number of days since the last day with an
above average high temperature. For some locations like Waterloo, it
has been over a month! Temperatures have been warming this week and
there is some hope for highs to reach the 50s before cooling off again
next week. If Waterloo were to finish the month with every day below
average for high temperature, it would be the first such occurrence for
the site since March of 1960.
The maximum temperature reported so far this year ranges from 45 over
northern Iowa to 70 over southern Iowa. The snow pack has been the
most extensive and persistent over northern Iowa helping to keep
temperatures cooler there. The forecast continues our slow moderation
this week, but colder weather will return for the start of April.
High temperatures on Thursday were much closer to average than they
have been recently. Many locations in the state have been below
average since the start of spring last week. The featured chart
presents the streak of days with a high temperature below average when
the first day of spring was also below average for Waterloo. Years
without a bar would indicate the first day of spring was above average
for high temperature. For Waterloo, the streak this year is the
longest since 1965, but should end today with highs expected in the mid
50s.


