Most of the state is below zero this Friday morning. The featured
chart presents an analysis of the ratio of days above 100 degrees to
days below 0 degrees Fahrenheit. Locations with more days below zero
have the ratio flipped to keep all values positive. Locations in white
are the closest to having equal days above 100 and below 0. Nearly all
of the Midwestern US has many more days below zero and there is a large
gradient over Iowa. Southwestern Iowa has roughly 10 times as many
days below zero than above 100, while Northeastern Iowa is around 100
times as many days! The moral of the story is that the number of days
below zero dwarfs the number of days above 100 for most of the region.
Last Sunday, much of the state picked up freezing rain with the
heaviest accumulations shown on the featured map over Northern Iowa. A
majority of the snowfall produced with this storm was north of the
state, but it was a significant winter storm for Iowa and thus the
inclusion in the running series on these events. Sorry about including
the analysis for storm number six before this one! A number of smaller
snow storms have been impacting the state in the past week as well. If
reports are generally less than 3 inches, they are not counted in this
analysis.
Our recent stretch of winter weather has seen numerous light snowfall
events. A big help for clearing off the primary roads in the state is
the sun. The featured chart presents a simple average of afternoon
pavement surface temperature near Marshalltown and the frequency of
having a sub freezing temperature. Solar declination increases each
day in the spring, which makes for more energy entering the pavement
and warmer temperatures. In February, it becomes increasingly less
likely to have freezing temperatures, which means any frozen water on
the surface will quickly melt.
Punxsutawney Phil comes out of his den on Groundhog's Day to make an
important forecast for the spring season. The featured top chart
presents the number of snow days for Ames before and after 2 February
each winter season. The bottom chart is simply the yearly total of
snow days after 2 Feb. Neither chart appears to show a meaningful
trend, but does indicate that we have on average just under 10 snow
days yet to go this winter season.
The featured chart displays the running departure from average for
statewide precipitation over three windows of time. The short term
windows of 30 and 90 days have shown some recent improvement with
precipitation totals this winter close to average. The long term
deficit over 365 days has deteriorated. How can short term deficits
improve while long term do not? The short term improvements this
winter are less than what happened last winter, so the net effect is
deterioration as slightly drier conditions this year replace wetter
conditions last year at this time.
The "IEM Freeze" application shows the combination of RADAR
reflectivity, pavement temperatures (dots), and air temperatures
(numbers) this morning. Temperatures so far are safely above freezing
where it is currently raining the most. In far northern Iowa,
temperatures are very close to freezing and some icing is taking place.
This system will work its way out of Iowa today, with our next storm
system arriving this weekend.
Most of the precipitation that fell on Thursday over Iowa was at
temperatures above freezing. Is that rare for the first week of
February? The featured chart presents the weekly frequency of hourly
precipitation reports from the Des Moines Airport with air temperatures
at or above 32°F. A caveat is that frozen precipitation can hit the
ground with temperatures slightly above freezing. For the first week
of February, the frequency is about 25%. The chances of these mostly
rain events dramatically increases by the end of this month with above
freezing events becoming the most common in March.
We have seen our share of precipitation producing storm systems this
year. These storms are a welcome sight after a very dry 2012. The
featured map shows the combination of the past 7 days worth of
precipitation and the US Drought Monitor valid on 5 February. The
driest areas in the state (shown by the D3 and D4 designations)
received the least amount of precipitation in the past week. The next
seven days appear to be mostly dry.
Our daylight time gets longer and the sun gets higher in the sky each
day in February, but does that make a difference for our day to day
high temperature. The featured chart shows the frequency of day to day
high temperature changes by month for Ames. While there is a clear
annual signal, the magnitude of the cycle is not that large. The
annual climatology of temperature is only a gentle tug on day to day
changes. Our daily temperatures are dominated by weather systems and
the translation of air masses over the state. Our highs this week will
creep a bit higher and then be cooler to end the week.
The featured image is a calendar of statewide averaged daily
precipitation since the first of the year. After a dry first four
weeks of the year, the next two were on the wet side with both snow and
rain events. Our current week started of wet, but now looks to remain
dry into next week. We are still in the winter season, so the chances
of getting large precip events is rather small. The month of March is
just a few weeks away and hopefully larger precipitation events as
well.
The past two days have been very pleasant for early February in Iowa.
Abundant sunshine and warm winds have helped to push temperatures near
50 degrees for some parts of Iowa. The lengthening days and increasing
solar incidence angle provide us with much more energy from the Sun
than just a few weeks ago. The featured chart is of recent daily solar
radiation reports from the Ames ISUAG site. The past two days have
totals that dwarf anything we have seen since the first of November.
Air masses are still very important this time of year and colder air
will arrive this evening with highs below freezing on Friday.
The present for us on Valentine's Day from Mother Nature was a strange
combination of sunshine, mild temperatures and brief downpours of snow!
The lower atmosphere was able to produce shallow convective like clouds
and have snow reach the surface with near surface air temperatures well
above freezing. The automated weather reports from the Des Moines
Airport included an observation of 40 degrees and light snow! The
featured chart presents the combination of reported temperature and day
of the year when the site reports falling snow. Having a temperature
of 40+ and falling snow is a rare combination and even more rare in
February. The overall maximum temperature on this chart is 46 back on
19 Oct 1964.
There is currently a lot of excitement over the upcoming winter storm
forecasted for Thursday into Friday. The featured chart looks at
forecasted precipitation totals for Des Moines from the GFS model. The
chart shows the current storm along with six recent heavy snowfall
events. Each bar represents one of the four model runs made per day
prior to the event. The general lack of consistency creates a
creditably issue for forecasters. The top series shows one model run
dumping a huge amount of precipitation and then backing off on the
total up until the event. The fifth and sixth chart show going from
having no precip to a storm. The caveat not illustrated here is the
storm track, by which small displacements can make a huge difference in
forecasted precipitation for a fixed location.
Those of you that fervently monitor the NWS forecast may have noticed
something interesting this past Sunday. For some locations in the
state, the NWS had a near 100% chance of precipitation forecasted for
Thursday. Is it common to see a 100% chance forecast at four days out?
The featured chart shows the frequency of this confident forecast based
on the afternoon zone forecast for Polk County (Des Moines). Based on
data back to 1 Jan 2009, this would appear to be the first time it has
happened for the day 4 forecast for Polk County. The chart nicely
shows that forecasters get more confident of predicting a 100% chance
as the event gets closer. Today's forecast for Thursday remains at
100%!
Tuesday was a brisk reminder of the winter season we are still in with
wind chill values below zero for most of the state. The featured chart
displays the daily frequency of having at least one wind chill reading
below zero. Three selected sites are shown for comparison. The
frequencies peak out around 60% for most of January and the first few
weeks of February. We are on the downward slope of this chart as we
creep closer to springtime.
The long advertised snow storm for Thursday is finally at hand. Snow
will get going this afternoon and last into Friday. The featured chart
presents the air temperature timeseries for Des Moines for the ten most
recent daily snowfall totals over six inches. Based on temperature and
hourly precipitation, a crude estimate is made of when the snowfall
started to normalize the chart. The chart nicely illustrates how
temperatures are generally steady during the snowfall event, with
warmer temperatures before and colder temperatures after. Temperatures
are also generally in the 20-30 degree range with the noticeable
anomaly being an event from Feb 2009, when we had once of the largest
snowfall events at a temperature near zero degrees. For this event,
temperatures will be steady in the mid 20s, but not much in the way of
colder air behind the system.
The long awaited snowstorm on Thursday is winding down this morning
after covering most of the state with around six inches. The heaviest
totals were in western Iowa with up to ten inches reported. Even
heavier amounts were over Kansas and Nebraska with locations just
southwest of Iowa picking up around a foot.
After a major snowstorm to end last week, another storm is cranking up
to our southwest and is expected to bring more snow to the state
tonight into Tuesday. Is it common to have back to back snowstorms
like this? The featured chart presents the frequency of having a
snowfall event within the 2 to 5 day period after a day with or without
snow. Day 1 is skipped since it is hard to differentiate two day
snowfall events from the same storm. The frequencies are partitioned
by the snowfall total. There appears to be an interesting signal in
this chart with the frequencies peaking for days after a three inch
total. While the blue bars represent all cases, the red bars denote
when the subsequent snowstorm produced a daily total larger than the
one proceeding it. So when there was an eight inch plus event, the
next snowstorm within two to five days was less intense for Des Moines.
Our recent bout with cold weather was about the relatively coldest
weather we have seen in the past year as shown by the featured chart of
daily average temperature departures. We are now getting closer to
March and one wonders if we can come close to repeating what happened
last March with persistent and extremely warm temperatures. But first
we have to finish February and some snow over southeastern Iowa today.
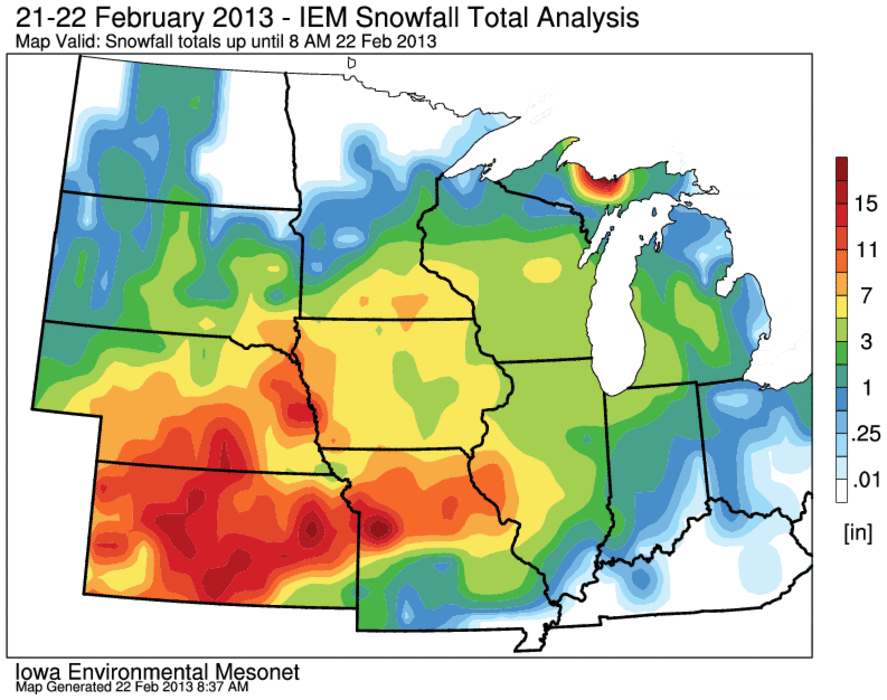
The snow is still falling this Wednesday morning and the totals are
approaching a foot in some locations in the state. A band of moderate
intensity snow setup Tuesday much further north and west than expected
resulting in the swath of higher totals you see on the featured map
between Des Moines and Waterloo. This map will be updated later today
as more reports come in and the analysis is improved.
Our most recent snow storm caused great gnashing of teeth as some areas
not expected to receive much snowfall got 8-12 inches! The featured
chart attempts to explain why this surprise happened. The GFS forecast
model is one of the models used by forecasters to predict the weather.
The model is run four times daily and each run produces a forecast out
the next week or so. The featured chart presents the model forecasted
precipitation for a grid cell over the Des Moines Airport. The top bar
displays what was observed. If you focus on the third column in the
grid where the most intense precipitation fell, you will see that the
model went from a dry solution for Des Moines to having a storm to then
again dry and the runs made on the 26th ramped up the totals
tremendously. These changes are due to storm track differences as the
model moved the storm initially south of Des Moines and then brought it
back.


