The most recent winter storm dumped an inch or so of snow over most of Iowa, but
combined with bitterly cold temperatures and strong winds, dangerous conditions were
present for a while Saturday evening over northern Iowa. The next winter storm system
arrives on Monday with much more snow expected from this system. Even colder air will
arrive after this next storm system with highs on Wednesday perhaps below zero for much
of the state.
A clipper system was able to dump significant amounts of fluffy snow over much of Iowa on
Monday evening. The featured analysis combines NWS COOP and Local Storm Reports to
show the swath of 5-7 inches with lesser amounts over northeastern Iowa and no snowfall
over southwestern Iowa. Very cold temperatures are now over Iowa with high temperatures
tomorrow expected not to breach 0F!
Air temperatures have dropped and winds have increased this morning. The combination of
both have conspired to create dangerous wind chills. Many schools have cancelled
classes today due to the wind chill. The NWS has issued a Wind Chill Warning for today
until noon for much of Iowa. The featured chart presents the frequency of when during the
day a wind chill warning is active for Story County (Ames). Rewording, when a wind chill
warning is active, what is the frequency during the day that the warning was active. The
afternoon hours are the least favored time, which makes sense as it will likely be the
warmest portion of the day. Products like these are issued on a 3 hour increment of time,
which is why there is a rapid cut off at noon.
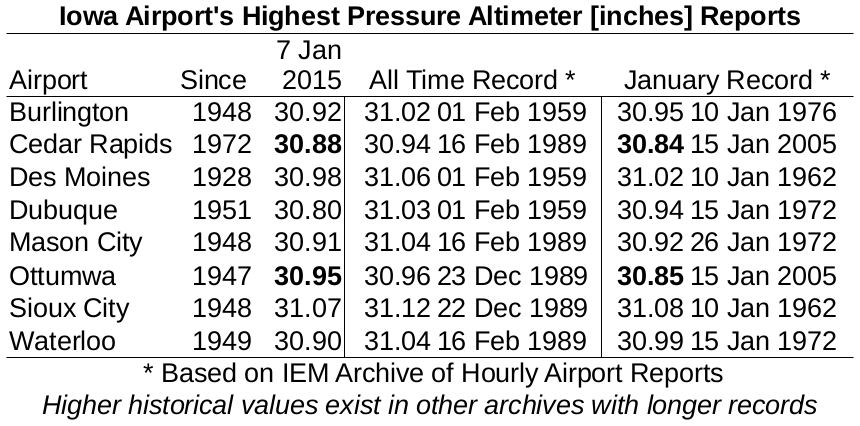
If you have sensitive sinuses, yesterday was probably not a very pleasant day for you as
air pressures were near the largest values ever recorded in the state. The featured table
displays IEM computed pressure records (as expressed by the pressure altimeter reading).
There are a number of caveats to this chart as locations in the state have different periods
of record and the maximum daily high pressure is something not commonly reported, so
this table simply lists out the maximum hourly value reported. Extreme high pressures like
this are found with dense areas of very cold air during the winter time.
Active winter weather has been the case for this week with strong winds driving a ground
blizzard over northern Iowa on Thursday afternoon. The featured chart presents the
headlines issued by NWS Des Moines since 3 January for their forecast area of
responsibility. The bars represent the time period that the headline was valid for at least
one forecast zone in the state. The have only been brief periods in the past seven days
that no headline was active.
While the vast majority of impacts from the most recent winter storm system were felt to
Iowa's south and east, a swath of snow did fall over extreme southeastern Iowa with totals
approaching 2-3 inches as you cross into Illinois. Cold air behind this system has arrived
this Monday morning and bitter cold sticking around into Tuesday. Warmer weather is in
the forecast for the upcoming weekend.
It is always a good idea to check in on how we look from space. With clear skies overhead
on Monday, the Terra MODIS satellite true color image shows the snow covered landscape
over Iowa. Just the southwestern corner of the state is free of snow at the moment. After
cold conditions today, temperatures are forecasted to approach 40 degrees by the
weekend.
The featured chart displays the frequency of having an air temperature within a given
range for Des Moines based on long term hourly temperature records. For January, about
75% of the time is spent at temperatures below freezing. In July, we spent about 75% of
the time at temperatures above 70. You can generate this plot on this website and pick the
intervals you are interested in for the station of your choice.
On Monday morning, the low temperature for Waterloo was -16 while just a few miles east
at Oelwein it was 8 degrees warmer at -8. The featured chart looks at differences in
morning low temperature between the two sites over the course of a year (top plot) and
against the average wind speed at Waterloo. The difference in temperature is due to micro
climate effects are that are much more common during low wind conditions. Near surface
winds help to mix the lower atmosphere and keep temperatures more evenly distributed.
When winds relax, local effects happen and rapid cooling may occur at night time. The
lower plot clearly shows the difference are most noticeable at low wind speeds. As wind
speed increases, the average difference in low temperature approaches zero. This creates
a forecasting issue when local weather stations can have large differences in low
temperature as compared with their nearby neighbors.
Our current rebound in temperatures to levels well above freezing are certainly a nice
break from the recent few weeks of cold weather. Climatology says that the middle of
January is the coldest time of the year, but climatology can be computed different ways.
The featured chart presents three daily temperature climatology metrics. The National
Climatic Data Center (NCDC) produces 30 year normals which are updated every ten
years. The chart shows the most recent two iterations of that product as well as the simple
daily average of long term observations. The 1971-2000 product was provided in whole
degree Fahrenheit, so that is why it jumps up and down on the plot. It is interesting to note
the difference between the 1981 product and the other two metrics.
Gusty winds on Saturday prompted the NWS Des Moines to issue a Wind Advisories for
portions of northern Iowa. The featured chart looks at how common the Wind Advisory is
issued by week of the year. The top chart displays the number of years with at least one
Wind Advisory for that week and the bottom chart displays the total number of advisories.
The plot shows a peak number of events in April with near no events during the July-
September period. Strong sustained winds are driven by temperature contrasts and during
the summer months, these strong contrasts are difficult to find over the central US.
The featured chart displays the frequency of the monthly precipitation total being at least
80% of average or higher for the past 20 years. The average is computed from the period
of record data. The chart shows that January has been one of the least reliable months to
get close to or above average precipitation totals. This month's total has yet to breach this
level, but there are a number of days left and a few chances of precipitation to come.
Highway frost was a major issue over Iowa on Tuesday morning. The featured chart
presents the combination of RWIS air, dew point, and pavement temperatures for US
Highway 30 near Jefferson along with the reported road condition by the Iowa State Patrol.
The clear issue shown in the chart is having the road temperature below the dew point,
which causes deposition of water vapor onto a frozen surface. Once the road temperature
raises above the dew point, the frost was gone and the road reported as dry.
Des Moines has seen three days so far this January at or above 50 degrees. The featured
chart presents the number of 50+ degree days in January for Des Moines. The long term
average is 2 days, so our total this year of 3 is doing very well. The forecast has warmer
weather returning with a chance of a few more days over 50.
The featured map plots season snowfall total departures for primary climate sites tracked
by the National Weather Service. Much of the Midwest is below long term average
including locations in Iowa. The near term forecast is not optimistic for accumulating
snowfall for Iowa, but there is still plenty of winter to come. Our largest snowfalls come in
late winter and early spring anyway.
Our most recent clipper winter storm system brought just an inch or two to portions of
southeastern Iowa. This storm system is now approaching the east coast and merge with
other energy to grow into a massive storm that is expected to bring blizzard conditions to
the northeastern US. Much of this snowfall for Iowa did not survive until Monday and warm
temperatures today will help to melt the rest of it.
The featured chart looks at the accumulation of snowfall events and totals relative to the
season average of each. For Des Moines, today is about the half way point for
accumulating both snowfall metrics. This means that typically we have seen half of our total
snowfall events and half of our total snowfall by this date in the winter season. There is a
subtle difference in the plot between the two lines, which is interesting to note. The events
accumulate faster initially and then the snowfall total catches up. The reason is that the
snowfall events during the first half of the winter are of lesser magnitude, on average, than
the events that happen during the later part of the season.
The featured chart displays the warmest January high temperature for Ames for each of the
past years on record. This year has seen temperatures above 50 degrees, which is just
slightly above average for maximum temperature for the month. The chart shows that while
each of the past four years has seen a 50+ temperature, the prior five years did not. The
amount of snow pack during January makes a big difference to how warm we can get.
Temperatures today are expected into the 50s for Ames, so get outside and enjoy it before
winter returns!
Our recent stretch of January weather has seen very pleasant temperatures for most of
Iowa. Some consider winter as a constantly frozen and harsh time in the midwest and it is
certainly like that at times, but the featured map shows that on average, high temperatures
are often above freezing for the period of December to February. A considerable gradient
exists in the midwest with frequencies dropping by about ten percentage points for every
climate district you travel north. The forecast has a return to daily highs below freezing and
some chances of snow.
Today's featured map presents the frequency of having a daily high temperature above
freezing with the daily low temperature being below freezing for the winter months of
December, January and February. Yesterday's feature showed that just about half of
Iowa's winter days have a high temperature above freezing. This map shows slightly
smaller values, but again about half of winter days have a high above freezing with a low
below freezing. The largest frequencies are shown over western Nebraska and Kansas
with just under 80% of days meeting this criteria.