2012 will go down as one of the drier years on record for Iowa as shown
by the featured graph of preliminary estimates for the state. This
past year was the driest since the drought of 1988 with only a handful
of other years drier since 1900. After four of the wettest years on
record between 2007-2010, these past two have bucked the recent trend.
While the calendar has changed, the drought of 2012 will roll on into
2013 and has near-zero chance of being busted before springtime.
The featured chart attempts to answer the question of what was missing
from the precipitation for Des Moines during 2012. The chart divides
up
the daily precipitation totals into 5 bins that over the long term have
each contributed 20% of the total. For example, the first bin of 0 to
0.29 inches on average provide 20% of the yearly total over an average
of
134 days. On the high end, there are an average of 3 events of over
1.51
inches providing another 20%. The red bars are what was observed in
2012
along with the contribution to the departure this year in red text.
One
category clearly dominates and that was a lack of events between 0.92
and
1.51 inches. While the difference in days at the lowest bin looks
significant, the actual departure of total rainfall was marginal.
The featured chart displays the daily difference in high and low
temperature between the Des Moines ASOS and Ankeny AWOS weather
station. Ankeny in a suburb of Des Moines and the sites are separated
by only 12 miles. Recently, the daily low temperature has differed by
up to 10 degrees Fahrenheit. The bottom chart shows that since June of
2012, Des Moines has almost always had a warmer overnight low
temperature. It is not clear what could be causing this phenomena, but
local micro-meteorological effects could certainly be at play here. It
is somewhat disconcerting to see systematic shifts in this comparison
that may be a sign of calibration or sensor issues. The Des Moines
site is a part of the federal ASOS network, while the Ankeny site is an
Iowa DOT AWOS site.
On Thursday, the temperature at 6 AM was a balmy 31 degrees for Des
Moines but then dropped to 18 at noon. The featured chart looks at how
common it is for the noon temperature to be colder than the 6 AM
temperature for each day of the year. This situation is certainly the
most common during the winter months when air masses dominate our
temperatures and the sun is the least effective at warming during the
daytime. The bottom chart presents the largest difference in
temperature between these two hours and for some days in the summer,
this situation has yet to happen for Des Moines. Friday will be a
different situation with warmer air and sunshine both conspiring to
push us to just above freezing!
This past weekend saw some mild temperatures on Saturday and was some
of the warmest weather we have seen since the blizzard on 20 December.
The featured chart displays the daily high and low temperature for Ames
since 1 December 2012 along with the daily climatology. The arrival of
snow certainly changed our weather as temperatures have been mostly
below freezing since. Moderation looks to be in store this week with
colder temperatures arriving for next week.
Above freezing temperatures and sunshine helped to melt some of our
snow
in Iowa on Monday. The featured chart is of latent heat flux from the
one
of the NLAE flux sites since the first of the year. Latent heat is a
measure
of the energy being transferred from the surface to the atmosphere as
the
result of evaporation or sublimation of water. In this context, a
positive number is a transfer of energy to the atmosphere. The large
spike on Monday is certainly indicative of the enhanced snow melt,
sublimation, and evaporation that was occuring. These processes
require
heat, so it acts to slow the surface air heating rate as energy is
consumed to change the phase of water. This is a big reason why
near surface air temperatures can not get too warm with snow on the
ground.
The National Climatic Data Center issued a report yesterday placing
2012
as the warmest year on record for the CONUS. While it was the warmest
year for Des Moines, it was not the warmest for all sites in the state.
The areal averaged temperature for Iowa came in a very close second
place
behind the year 1931. The featured image presents the year to date
average temperature for 1931 and 2012 in the top chart and the monthly
average temperature departures in the bottom chart. It is interesting
to
note how August for each year was similar and both very close to
average.
The last four months of the year show why 1931 was able to remain
number
one in Iowa. Please note that these numbers are IEM estimates and do
not
match the NCDC estimates, but we both have 2012 coming in second for
Iowa.
Temperatures are expected to warm nicely on Thursday and again on
Friday
before crashing into the weekend. The featured chart presents 24 hour
temperature traces in between a day to day high temperature change of
at
least 30 degrees. The zero hour in this chart is after the peak
temperature occurred for the first day. These events are almost always
associated with cold front passage. The average fit line shows how
quickly these events tend to occur with the temperature dropping 30
degrees within the first 8 hours. It remains to be seen if the high
temperature on Saturday will be 30 degrees cooler than Friday.
Some of the forecast model runs made earlier this week were advertising
a significant rainfall event on Thursday as shown by the featured
chart. The chart shows the 6 hour interval forecasted precipitation
for Des Moines from the GFS model that runs 4 times per day. Des
Moines ended up with just over a tenth of an inch of rain. The
forecast looks dry and cold for the next week.
Voting: Good - 75Bad - 12
Sun Jan 13, 2013
View larger image — daryl and Liz Herzmann, along with young Margaret
A long standing need of the mesonet project was to clone the primary
developer. On Sunday, this need was fulfilled with the addition of
Margaret Ann as shown by the featured image. She is doing well and
will be in intensive computer programming training with dad for the
next few days, so dad may not respond to your emails immediately :)
The meteorological winter season from 1 Dec to 28 Feb is now half over
and
it has been on the warm side of average so far. The featured chart
presents the statewide areal averaged temperature for the 1 Dec to 15
Jan
period each year since 1900. Years above long term average are shown
in
red. The forecast for the next seven days has us starting off on the
warm
side with much colder temperatures arriving this weekend.
The southern plains have seen a number of bouts with severe weather so
far this year. The featured chart presents the number of severe
thunderstorm and tornado warnings issued between 1-16 January each year
since 1986 along with the total for each year. Active or inactive
severe weather starts to the year do not appear to indicate what the
yearly total will be. Iowa's severe weather season is still a few
months away, but our weather will become severely cold this weekend.
What makes for a brutal winter season? Perhaps having a streak of days
below a certain temperature would qualify. The featured chart presents
the longest streak of days below a given temperature for each winter
season since 1893. A few of the most brutal years are highlighted
along
with the simple average of the lines plotted. Our upcoming bout with
cold
air will be intense, but does not look to persist for very long. The
lack
of snow cover makes persistent cold difficult to come by.
Temperatures warmed nicely on Saturday into the 50s, placing us over a
standard deviation from average for the date (called sigma).
Temperatures have since crashed and will struggle in the single digits
today, which less than negative one sigma from average. The featured
chart looks at how often this change of going from at least a positive
one sigma high temperature to lower than a negative one within three
days. The top chart shows that January is the least frequent month for
this event as warm air surges are the least common. The bottom chart
presents the yearly total of these events and last year saw the second
most at 12 days.
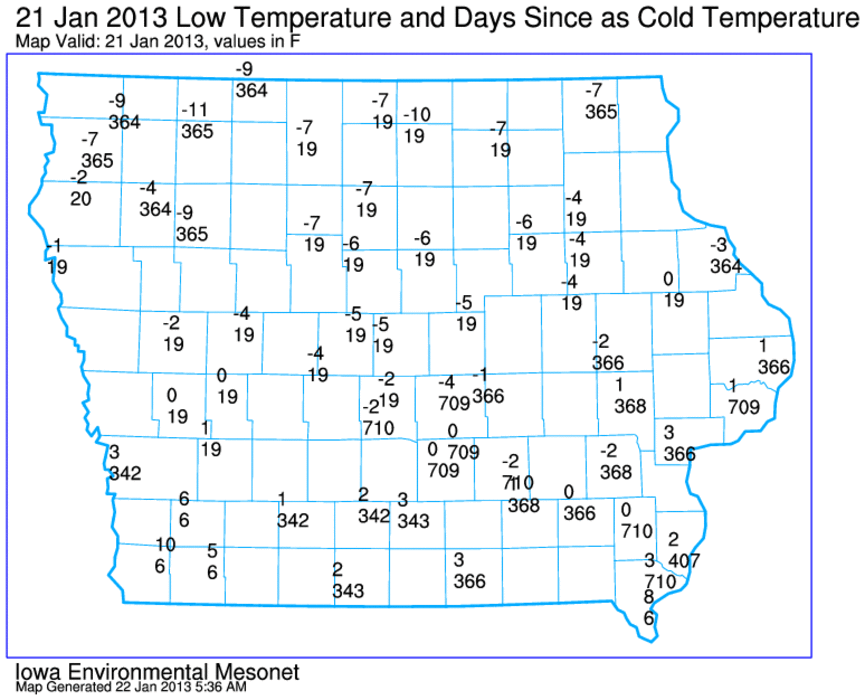
The coldest air in two years for some locations in Iowa arrived on
Monday
and remains over Iowa today. The featured map presents the low
temperature on Monday along with the number of days since as cold of a
temperature. For the Des Moines Airport, the -2 was the coldest since
February 2011 and the first temperature below zero since then as well.
The cold air will stick around this week before warmer air arrives next
week.
Our recent bout with cold weather was the coldest of the season. Ames
reported negative five for a low temperature, which tied the lowest
temperature for the season. Is colder weather to come or is this it?
The
featured chart looks at the coldest temperature of the winter season
and
the date on which it occurred. There is certainly plenty of time for
colder
weather to occur and negative five would be one of the warmer
temperatures on record for a winter minimum. Selected
warm, cold, and March events are labelled on the plot.
The seasonal total of snowfall for Des Moines is about 34 inches. This
is
a result of many individual snow storms during the season. The
featured
chart looks at the contribution of snow storms of various size to the
seasonal total. The five bins presented approximately divide up the
total
snowfall equally. The bar height and number above the bar are the
average
number of days per season with a snowfall within the shown interval.
Roughly 70% of the snowfall events only provide 25% of the total
snowfall.
Des Moines has only seen a handful of snowfall events this season and
is
below average so far.
The featured map presents an analysis of the average number of hours
per year that the wind chill reading is below zero. The total number
of hours is presented in units of 24 hour day periods for easier
comprehension. While there are some local poor data effects, the north
to south pattern is clear with the nation's ice box around 50 days and
the south under 1 day. The gradient over Iowa is fairly strong with
northern Iowa near 30 days and southern Iowa around 10. The past week
has seen the coldest wind chills over north central Iowa, which makes
the preferred region in the state for the most frequent sub zero wind
chills.
Our most recent storm brought significant freezing rain to Iowa with
the largest accumulations over northeastern Iowa. The featured chart
looks at the combination of air temperatures with reported road
conditions for two locations along Interstate 35. While both locations
received freezing rain, conditions improved significantly for Ames as
the air temperature rose above freezing. For Mason City, temperatures
are still just below freezing and thick fog is not helping the tricky
driving conditions this Monday morning.
It was a struggle on Monday for some locations in Iowa to warm up.
Spencer reported a high temperature just four degrees warmer than the
low temperature. The featured chart presents the frequency of having
such a small temperature difference per month. Overall, these events
happen a few times per year with the coldest half of the year being the
preferred period. In the summertime, it is very difficult to keep the
sunshine from warming us up as extremely optically thick clouds tend
not to persist the entire day.
The featured chart displays a time series of air temperature for Cedar
Rapids and NWS issued alerts for Linn County since Saturday. We have
gone from cold temperatures, to freezing rain, to dense fog near
freezing, to severe thunderstorms, to record high temperatures, to a
winter storm and finally brutal cold temperatures. "This is Iowa
Weather" many proud Iowans exclaim, but this stretch has been unique
and certainly not what typically happens most of the time. Wind Chill
Advisories are also in effect for portions of Iowa on Thursday as
bitter cold air rushes into the state.
The warmer weather earlier this week is now a distant memory and much
of the state is now covered with fresh snowfall. The featured analysis
of snowfall reports from the event show the highest totals near
Waterloo around 8-10 inches. Northwest Iowa completely missed out and
totals were much smaller over Southeastern Iowa. While every little
bit of snow certainly does not hurt the drought situation, they are not
sufficient to make significant impacts to soil moisture recharge. It
would probably be better to thaw the soil and get many rainfall events
during the early spring. Beggars can not be choosers at this point!