2020 Humidity
Posted:
The amount of water vapor the air can hold is a function of its temperature. So it makes sense that
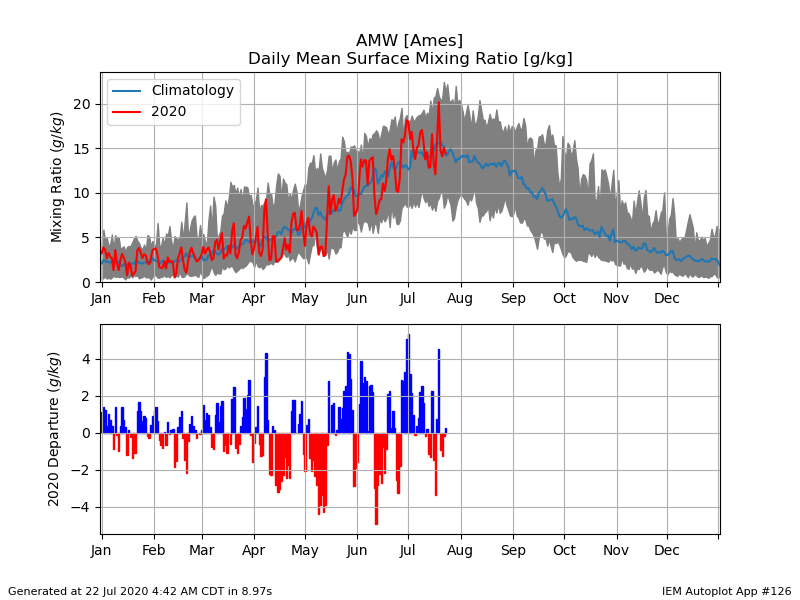
the peak in humidity happens about the same time as temperature as shown by the featured chart.
The chart presents humidity climatology for Ames expressed in terms of mixing ratio. The envelope
of daily data is shown by the gray shaded area, the simple average by the blue line, and this year's
values by the red line. The bottom panel shows the daily departure from average. It is interesting to
note that even our lowest humidity values on record during the summer are still about double that of
the highest winter values. The forecast shows a rise in humidity by the end of the week with a muggy
and hot weekend in store.
Voting:
Good = 10
Bad = 0
Tags: humidity 2020
Voting:
Good = 10
Bad = 0
Tags: humidity 2020
