Information Last Ob Photographs Calibration Meteogram Network Table Neighbors Monthly Summaries Observation History Wind Roses Custom Wind Roses Data Calendar
| Mar 2024 | Apr 2024 | May 2024 | ||||
|---|---|---|---|---|---|---|
| Sunday | Monday | Tuesday | Wednesday | Thursday | Friday | Saturday |
| 31 | 01 High: 35.2508 Low: 28.9724 Rain: 0.51 RH% Min/Max: 91-100 Feel Min/Max: 29 to 35 | 02 High: 50.846 Low: 32.5616 Rain: 0.02 RH% Min/Max: 54-100 Feel Min/Max: 33 to 51 | 03 High: 50.054 Low: 29.534 Rain: 0.00 RH% Min/Max: 37-95 Feel Min/Max: 30 to 50 | 04 High: 54.932 Low: 26.0114 Rain: 0.00 RH% Min/Max: 36-81 Feel Min/Max: 26 to 55 | 05 High: 56.084 Low: 22.5716 Rain: 0.00 RH% Min/Max: 32-94 Feel Min/Max: 23 to 56 | 06 High: 61.142 Low: 33.8216 Rain: 0.11 RH% Min/Max: 32-84 Feel Min/Max: 34 to 61 |
| 07 High: 54.5 Low: 36.8312 Rain: 0.44 RH% Min/Max: 76-99 Feel Min/Max: 37 to 54 | 08 High: 48.848 Low: 35.6324 Rain: 0.04 RH% Min/Max: 79-100 Feel Min/Max: 36 to 49 | 09 High: 61.358 Low: 31.5644 Rain: 0.00 RH% Min/Max: 48-100 Feel Min/Max: 32 to 61 | 10 High: 68.954 Low: 34.754 Rain: 0.00 RH% Min/Max: 30-89 Feel Min/Max: 35 to 69 | 11 High: 55.112 Low: 36.8798 Rain: 0.01 RH% Min/Max: 53-99 Feel Min/Max: 37 to 55 | 12 High: 61.502 Low: 30.3908 Rain: 0.00 RH% Min/Max: 31-98 Feel Min/Max: 30 to 62 | 13 High: 85.136 Low: 32.5112 Rain: 0.00 RH% Min/Max: 24-79 Feel Min/Max: 33 to 83 |
| 14 High: 74.516 Low: 45.5558 Rain: 0.00 RH% Min/Max: 17-75 Feel Min/Max: 46 to 75 | 15 High: 79.286 Low: 39.9344 Rain: 0.00 RH% Min/Max: 19-64 Feel Min/Max: 40 to 79 | 16 High: 68.288 Low: 47.858 Rain: 0.66 RH% Min/Max: 37-99 Feel Min/Max: 48 to 68 | 17 High: 57.758 Low: 43.772 Rain: 0.13 RH% Min/Max: 58-100 Feel Min/Max: 44 to 58 | 18 High: 48.308 Low: 30.4088 Rain: 0.53 RH% Min/Max: 49-98 Feel Min/Max: 30 to 48 | 19 High: 45.3146 Low: 25.4174 Rain: 0.00 RH% Min/Max: 44-93 Feel Min/Max: 25 to 45 | 20 High: 44.555 Low: 27.2336 Rain: 0.00 RH% Min/Max: 45-76 Feel Min/Max: 27 to 45 |
| 21 High: 60.476 Low: 22.9586 Rain: 0.00 RH% Min/Max: 21-83 Feel Min/Max: 23 to 60 | 22 High: 68.414 Low: 35.393 Rain: 0.00 RH% Min/Max: 31-61 Feel Min/Max: 35 to 68 | 23 High: 64.418 Low: 37.3118 Rain: 0.00 RH% Min/Max: 34-74 Feel Min/Max: 37 to 64 | 24 High: 52.502 Low: 29.6978 Rain: RH% Min/Max: 61-95 Feel Min/Max: 30 to 53 | 25 High: M Low: M Rain: | 26 | 27 |
| 28 | 29 | 30 | 01 | 02 | 03 | 04 |
The data presented here provided by IEM API webservice: daily.json. A simple CSV option exists as well.
Daily High/Low Plot

Description: This chart of the monthly temperature data. The bars are the observations and the dots are climatology.
Daily Rainfall
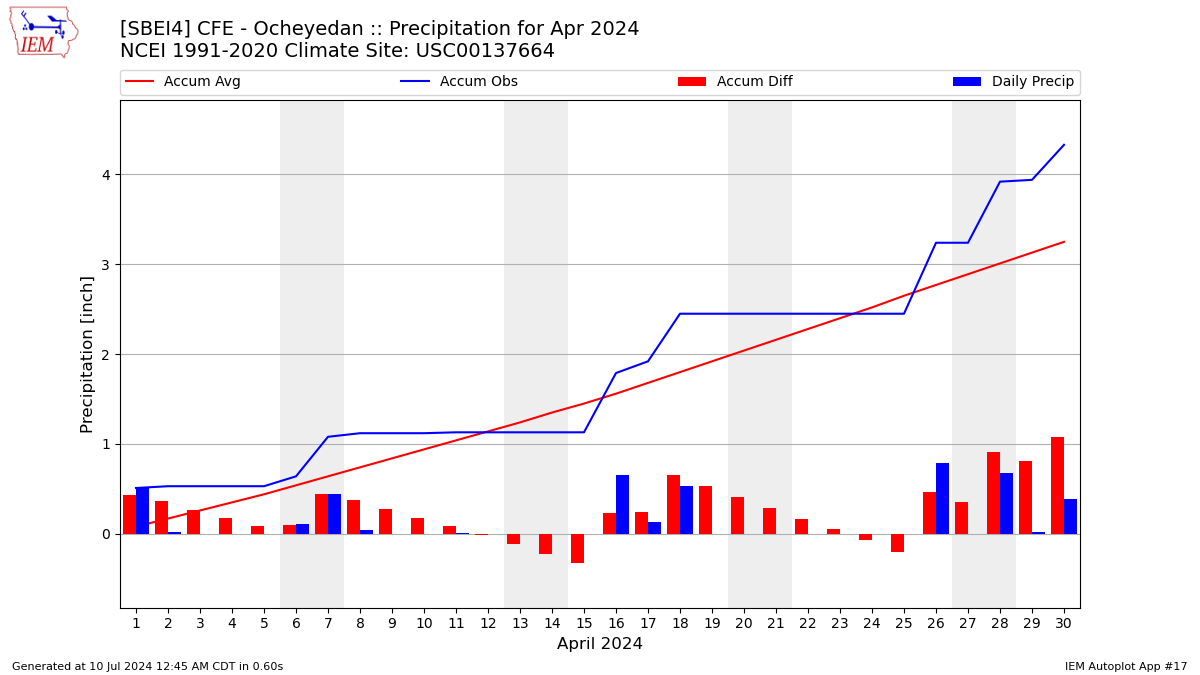
Description: This chart is of daily precipitation for the month. The red line would be an average month while the blue line and bars are observations.
Daily Average Wind Speeds

Description: This chart is of the daily average wind speeds.
The data presented here provided by IEM API webservice: daily.json. A simple CSV option exists as well.