Past Features
This page lists out the IEM Daily Features for a month at a time. Features have been posted on most days since February 2002. List all feature titles.
Tue Sep 02, 2014

End of Summer
02 Sep 2014 05:42 AM
Labor Day is considered the unofficial end of summer, but does summer really end near Labor Day? If one considers the warmest 91 day stretch of the year to be summer, then this saying is a close approximation. The featured chart shows the end date of the warmest 91 day period for the areal averaged temperature for Iowa. The end date this year is shown as August 26, so we have been out of summer for a number of days now! The average end date is near 7 September. A simple linear fit is shown to this chart, the trend is the period to end sooner each yet.
Voting: Good - 9 Bad - 6
Tags: summer
Generate This Chart on Website
Wed Sep 03, 2014

Precip Bins
03 Sep 2014 05:44 AM
The featured chart looks at the contribution to yearly precipitation total and number of rainy days that individual daily precipitation values have. For this analysis, the daily precipitation is binned into five ranges that over the long term history each contribute 20% to the yearly total precipitation. The bars represent the number of days per year with a daily precipitation within that range. For Des Moines, approximately 72 days per year receive between 0.01 and 0.29 inches of precipitation. The red bars represent what has happened so far this year, with the red labelled percentages indicating the departure the total rainfall for that bin has had this year. A lot is going on! For this year, the largest intensity bin has seen seven days versus just an average of three days and these seven days have exceeded the bin total accumulation by 24%. Of course, the 2014 values are still accumulating and the blue bars represent the full year average.
Voting: Good - 11 Bad - 6
Tags: precip
Generate This Chart on Website
Thu Sep 04, 2014

Changing Albedo
04 Sep 2014 05:41 AM
The featured chart presents local noon measurements of shortwave radiation from one of the NLAE Flux sites near Ames. The downwelling radiation is what makes it to the ground from the sun after passing through the atmosphere. The upwelling radiation is what is reflected by the surface and begins to travel back out into space. The ratio between these two values is known as albedo. A bare ground, a ground covered by snow, and a ground covered by vegetation have different values for albedo. The featured chart shows how the albedo changes over this year with noticeable differences appearing during periods of snow cover and as the corn crop vegetation increase its leaf area index and color.
Voting: Good - 22 Bad - 10
Tags: albedo
Fri Sep 05, 2014

Low Temp Changes
05 Sep 2014 05:43 AM
The low temperature for Des Moines on Thursday was a balmy 76 degrees and much warmer than Wednesday. The low temperature for Friday will be much cooler than yesterday. The featured chart presents the frequencies of day to day changes in low temperature. While the average high and low temperature are decreasing each day as we head into fall, the day to day changes are not always negative this time of year. This illustrates an important distinction between weather and climate. While climate is "pulling" us cooler each day, the weather is actually guiding the day to day differences. The chart does show an annual signal, but the magnitude is only a few percentage points.
Voting: Good - 17 Bad - 25
Tags: lows
Generate This Chart on Website
Mon Sep 08, 2014

Cycling Around
08 Sep 2014 05:45 AM
The featured chart displays a time series of temperature and precipitation departures for Iowa statewide averaged values since late May. For every seven days, the lagging 14 days departure is plotted. Charts like this tend to cycle around as we move between wet / dry and cold / hot periods. It is interesting how we have seen two distinct wet periods. Will we cycle back down to dry and cold or go somewhere else?
Voting: Good - 11 Bad - 7
Generate This Chart on Website
Tue Sep 09, 2014
Thunderstorm and Winds
09 Sep 2014 05:05 AM
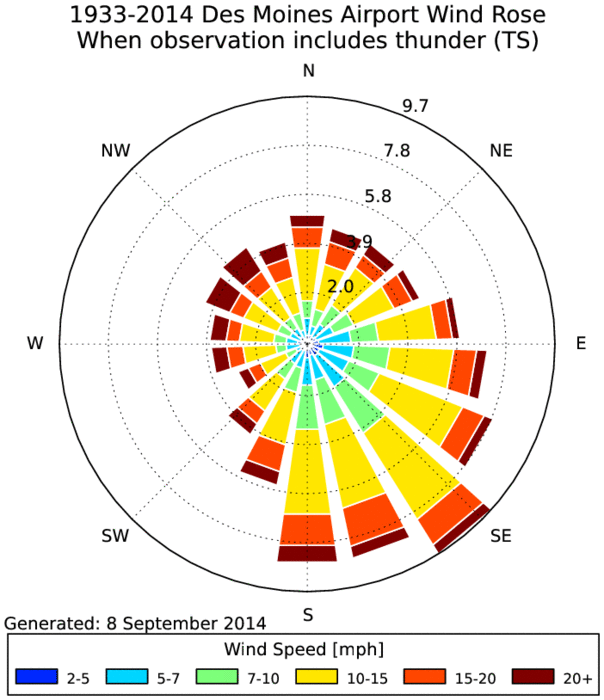
The Des Moines Airport automated weather station reported a thunderstorm yesterday afternoon along with southeasterly winds. The featured wind rose presents the wind speed and direction during which a thunderstorm is reported within the present weather observation of the site. Thunderstorms are driven by instability in the atmosphere, which is the combination of warm and moist air. Our primary source of that type of air is from the southeast, so it makes sense to see that wind direction dominate the frequency shown in the wind rose. While Iowa gets the warmest air from the southwesterly directions, that air is typically much drier and thus less likely to help promote thunderstorm development. More thunderstorms are expected today.
Voting: Good - 18 Bad - 10
Tags: asos thunder
Generate This Chart on Website
09 Sep 2014 05:05 AM
The Des Moines Airport automated weather station reported a thunderstorm yesterday afternoon along with southeasterly winds. The featured wind rose presents the wind speed and direction during which a thunderstorm is reported within the present weather observation of the site. Thunderstorms are driven by instability in the atmosphere, which is the combination of warm and moist air. Our primary source of that type of air is from the southeast, so it makes sense to see that wind direction dominate the frequency shown in the wind rose. While Iowa gets the warmest air from the southwesterly directions, that air is typically much drier and thus less likely to help promote thunderstorm development. More thunderstorms are expected today.
Voting: Good - 18 Bad - 10
Tags: asos thunder
Generate This Chart on Website
Wed Sep 10, 2014

Intense September Rainfall
10 Sep 2014 05:47 AM
Heavy rainfall has fallen over the past 48 hours with MRMS Q3 estimates showing much of southern Iowa in the 4-6 inch range. These estimates have been trending a bit too high lately with observations an inch or two less than what is shown. Some more rainfall is in the forecast, but totals will not approach what we have recently experienced. It will certainly start to feel like fall with temperatures well below average.
Voting: Good - 18 Bad - 6
Tags: sep14
Generate This Chart on Website
Thu Sep 11, 2014

Sept 11th, 2001
11 Sep 2014 05:43 AM
It is hard to believe that 13 years have already passed. May we never forget.
Voting: Good - 5 Bad - 6
11 Sep 2014 05:43 AM
It is hard to believe that 13 years have already passed. May we never forget.
Voting: Good - 5 Bad - 6
Fri Sep 12, 2014

Mid 30s Coming?
12 Sep 2014 05:45 AM
The featured map displays NWS forecasted low temperatures for Saturday morning. Mid 30s are expected over much of the state! It is very early in the season to see temperatures this cold. Snow fell on Rapid City, SD yesterday, which was the earliest recorded snowfall since they started keeping records there back in late 1800s. Temperatures will warm a bit after Saturday, but still be below average for the next week.
Voting: Good - 21 Bad - 24
Tags: sep14
Mon Sep 15, 2014

A few 31s reported
15 Sep 2014 05:44 AM
The forecasted cold temperatures for Saturday morning materialized as shown by the featured chart of NWS COOP reported lows. A few locations even reported sub 32 degree lows. Two locations (Dubuque and Burlington) along the Mississippi River reported just 40 for a low temperature as the warm water helps hold temperatures a bit warmer than surrounding areas. The forecast for this week looks very pleasant and not this cold at night.
Voting: Good - 14 Bad - 6
Generate This Chart on Website
Tue Sep 16, 2014

Past Five Months
16 Sep 2014 05:42 AM
The featured chart displays hourly air temperature reports from the Ames Airport weather station along with the daily low to high temperature climatology. Our recent weekend of very chilly air had high temperatures below the average lows for the date! The chart shows that very warm periods have been difficult to come by with some of the warmest weather only recently occurring. The blue section of the chart continues to bend downwards as we slide into fall with climatology pulling us a bit cooler each day.
Voting: Good - 19 Bad - 7
Generate This Chart on Website
Wed Sep 17, 2014

Greener than 2012
17 Sep 2014 05:46 AM
Clear skies on Tuesday provided the Aqua MODIS satellite an unobstructed view of Iowa's landscape. The featured chart compares the MODIS true color product for yesterday with a close date from 2012. The weather for 2012 was nothing like what has happened this year with 2012 being hot and dry while this year has been cool and wet. The agricultural crops still need more heat units to reach maturity this year and so that explains the obvious difference in greenness.
Voting: Good - 21 Bad - 7
Tags: modis satellite
Thu Sep 18, 2014

Common Temperatures
18 Sep 2014 05:47 AM
The featured chart presents the frequency of daily high and low temperature combinations for Ames. The largest frequency to have a high of 84 to 86 and a low of 60 to 62, which is roughly the climatology for much of the summer season. The chart shows an interesting artifact around the freezing mark with higher frequencies showing up just below freezing for the daily low temperature. It is relatively more common to have a low temperature just below freezing than to have one just above. The reason being during the cold season with snow on the ground and/or cold soils, the temperature will often drop to below freezing after a daytime temperature above freezing. Restating, it is difficult for the air to maintain a warm temperature at night when the soil and/or snow are at sub-freezing temperatures.
Voting: Good - 13 Bad - 6
Tags: high low
Generate This Chart on Website
Fri Sep 19, 2014

Monthly Hours of Precip
19 Sep 2014 05:43 AM
The automated airport weather stations provide hourly reports of precipitation. The featured chart shows the number of hours that measurable precipitation was reported for this year and on average for Ames. This chart does not show the time duration of precipitation as an hourly report of precipitation does not mean it precipitated for the entire hour period. Anyway, this year has seen most of its months above long term average with August at about double of average. The forecast is mostly dry with some chances of rain today and Saturday.
Voting: Good - 26 Bad - 18
Tags: precip
Generate This Chart on Website
Mon Sep 22, 2014

Equinox and Driving
22 Sep 2014 05:44 AM
The fall equinox is today, which means the entire globe gets roughly 12 hours of daylight. This is also a time of year that there are concerns about driving during sunrise and sunset. The reason being the azimuth at which the sun rises and sets is due east and west. This happens to be a main orientation of many roads in the state as shown by the featured chart. The chart shows an analysis of road orientation as computed by taking each of the road segments in a GIS coverage of roads and then computing their respective orientations. Each segment is weighted by its length to produce the chart. Being a flat state certainly allows a vast majority of the roads to be oriented N-S and E-W.
Voting: Good - 13 Bad - 7
Tags: equinox roads
Tue Sep 23, 2014

Three Week Change
23 Sep 2014 05:41 AM
The featured map displays the three week change from 1 to 22 September of the average high temperature climatology based on the NCDC 1981-2010 dataset. One might use this map to explain where the fall season first arrives in the CONUS as the largest temperature changes are over the upper great plains. In general, the closer you are to major bodies of water, the slower the decline in temperatures will be. These water bodies have accumulated heat over the summer and they release it slower than surrounding land areas do. The opposite affect happens in the spring time as it takes longer for these areas to warm.
Voting: Good - 17 Bad - 10
Generate This Chart on Website
Wed Sep 24, 2014

80s in September
24 Sep 2014 05:38 AM
There is some hope that we'll reach 80 degrees later this week as our stretch of very nice fall weather continues. The featured wind rose presents the wind direction and speed frequencies when Ames September temperature is at or above 80. The dominate wind direction is clear with southerly winds the most common, which makes sense as it is our source of warmer air. The winds will be out of the south for much of the rest of the week, but speeds are not expected to be all that strong.
Voting: Good - 11 Bad - 7
Tags: windrose sep
Generate This Chart on Website
Thu Sep 25, 2014

Missed Rainfall Forecast
25 Sep 2014 05:38 AM
The rain that fell over central Iowa on Wednesday was largely unforecasted by the main weather forecast models run in the US. The featured chart displays grid point output from the GFS model for Ames. This model is run four times per day and for this analysis produces a precipitation forecast at three hour intervals. The top row of data is actual observations from the Ames Airport and the grid below represents the forecasts made from each successive model run. Ames picked up over 0.6 inches with some very isolated values over an inch for Central Iowa. It is interesting to see an event missed like this and provides confirmation that there is still room for humans in the weather forecasting process!
Voting: Good - 15 Bad - 6
Tags: model
Fri Sep 26, 2014

80 Degree Period
26 Sep 2014 05:37 AM
Temperatures are expected to warm nicely today and approach 80 degrees, which would extend the period this year in between the first and last 80 degree temperature. The featured chart shows these periods and presents a linear fit trend line to both the first and last day of the year at this threshold. Even after today, temperatures will remain very seasonal with highs in the upper 70s at least until the end of next week.
Voting: Good - 27 Bad - 21
Tags: 80
Generate This Chart on Website
Mon Sep 29, 2014

80s for all
29 Sep 2014 05:45 AM
The weather this past weekend was very nice for fall with highs on Sunday in the 80s for all of the state as shown by the featured map. These temperatures were 10-15 degrees above average for this time of year. The forecast for this week continues the warm weather with some chances of rain as well. The warm weather will help the agricultural crop harvest ongoing in the state, but the rain will make field conditions difficult.
Voting: Good - 12 Bad - 7
Generate This Chart on Website
Tue Sep 30, 2014

Close to Average is Uncommon
30 Sep 2014 05:39 AM
Temperatures again warmed very nicely on Monday for most of Iowa with much of the state again in the 80s. For Ames, the high was 10 some degrees above average, but is that uncommon for this time of year? The featured chart presents the frequency that the daily high temperature is within five degrees of the present day climatology average. The 50% line is highlighted as values larger than 50 represent the most common case. So for much of the year, having a high temperature within this range is not the most common as temperatures are typically either cooler or warmer than +/- five degrees. During the summer time, the frequencies are the highest as our overall temperature spread is dampened by high humidity levels and warm soil temperatures.
Voting: Good - 17 Bad - 7
Generate This Chart on Website